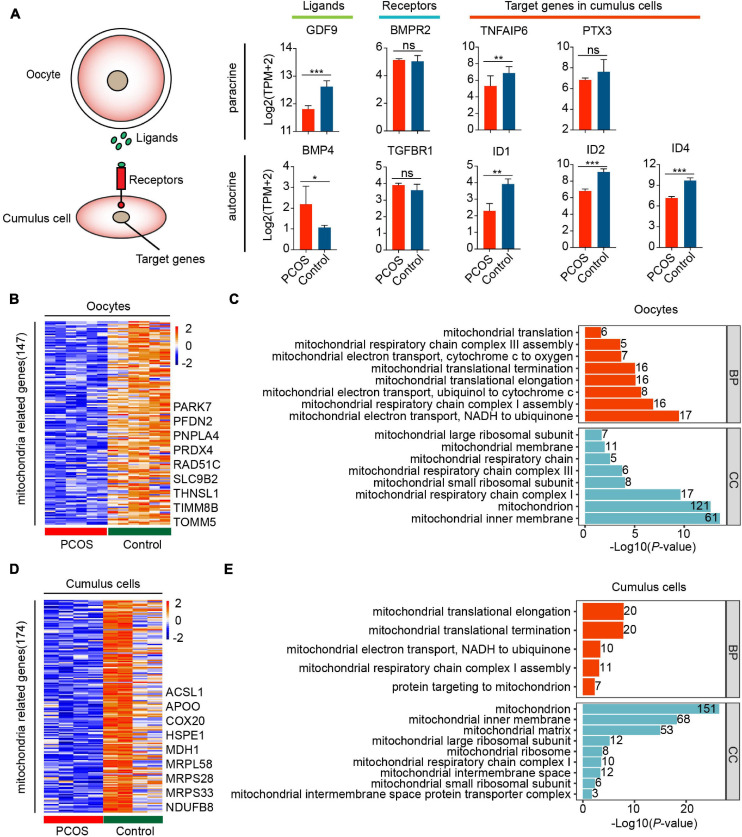
FIGURE 3.
Disorder of mitochondrial function and communication in CCs and oocytes with PCOS. (A) The TGF-β signaling pathway is involved in the oocyte–GC interactions. The schematic diagram at the left shows the relationship among these genes. The diagrams at the right show the relative expression levels [log2 ([TPM+2)] of ligands, receptors, and target genes between PCOS and control in oocytes (n = 3 participants) and CCs (n = 2 participants). Data represents mean ± SD. *p < 0.05, **p < 0.01, ***p < 0.001, ns, not significant. (B) Heat map of DEGs involved in the mitochondria that were downregulated in oocytes with PCOS. (C) Gene ontology (GO) enrichment analysis of downregulated mitochondria genes in PCOS oocytes. The red bars represent biological process (BP), and the blue bars represent cellular component (CC). (D) Heat map of DEGs involved in mitochondria downregulated in PCOS CCs. (E) GO enrichment analysis of downregulated mitochondria genes in PCOS CCs.

