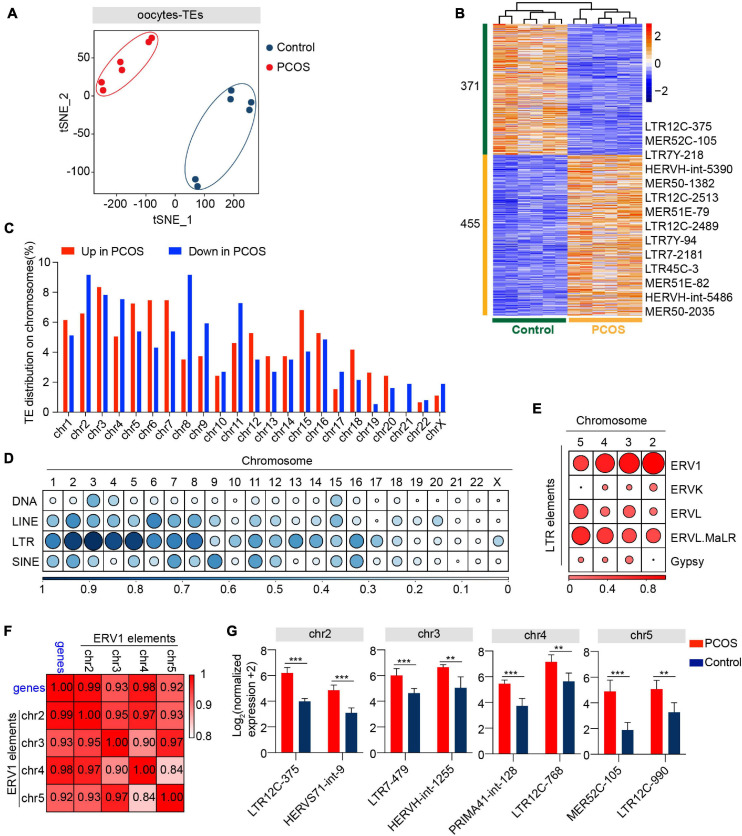
FIGURE 4.
Retrotransposons in PCOS and control oocytes. (A) Visualization of transposable element (TE) expression of oocytes by t-SNE, showing two clusters, including one for PCOS oocytes and the other for control oocytes (n = 6). Each dot corresponds to one oocyte, clustered by color. (B) Heat map of differentially expressed TEs (DETs) in oocytes between PCOS and control. The number of up-DETs is 455 and down-DETs is 371. The color key from blue to red indicates the relative gene expression levels from low to high, respectively. (C) The proportion of differentially expressed TEs in each chromosome. The red bars represent the percentage of upregulated TEs, and the blue bars represent the percentage of downregulated TEs. (D) Proportion of DETs classified by repeat classes on different chromosomes. Dots from large to small or color from dark to light represents the proportion from high to low. (E) Proportion of differentially expressed long terminal repeat (LTR) elements classified by repeat super-families on chromosomes 2, 3, 4, and 5. (F) Correlation between the expression levels of ERV1 elements on chromosomes 2, 3, 4, and 5 and of protein-coding genes in PCOS oocytes. The correlation coefficient is shown on the plot. (G) The expression levels of differentially expressed ERV1 elements on chromosomes 2, 3, 4, and 5 in PCOS oocytes, and also shown are two differentially expressed ERV1 elements on each chromosome.

