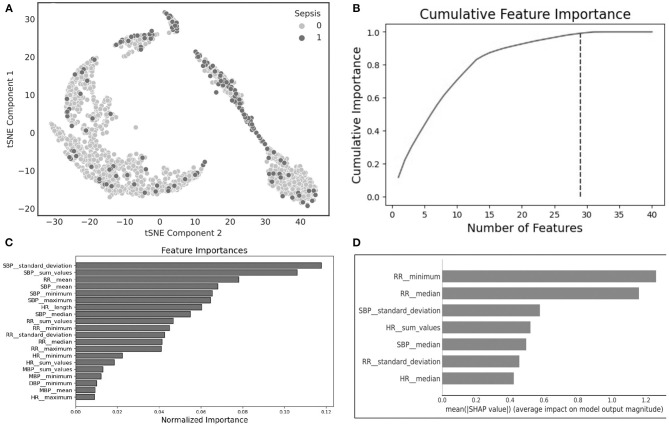
Figure 1.
(A) t-Distributed stochastic neighbor embedding (tSNE) plot characterizing sepsis (dark purple) and non-sepsis clusters (pink); (B) cumulative feature importance identifies 29 features that explain 99% of the data; (C) feature importance generated using light gradient boosted machines; (D) explainable importance with SHapley Additive exPlanations (SHAP) after feature selection.

