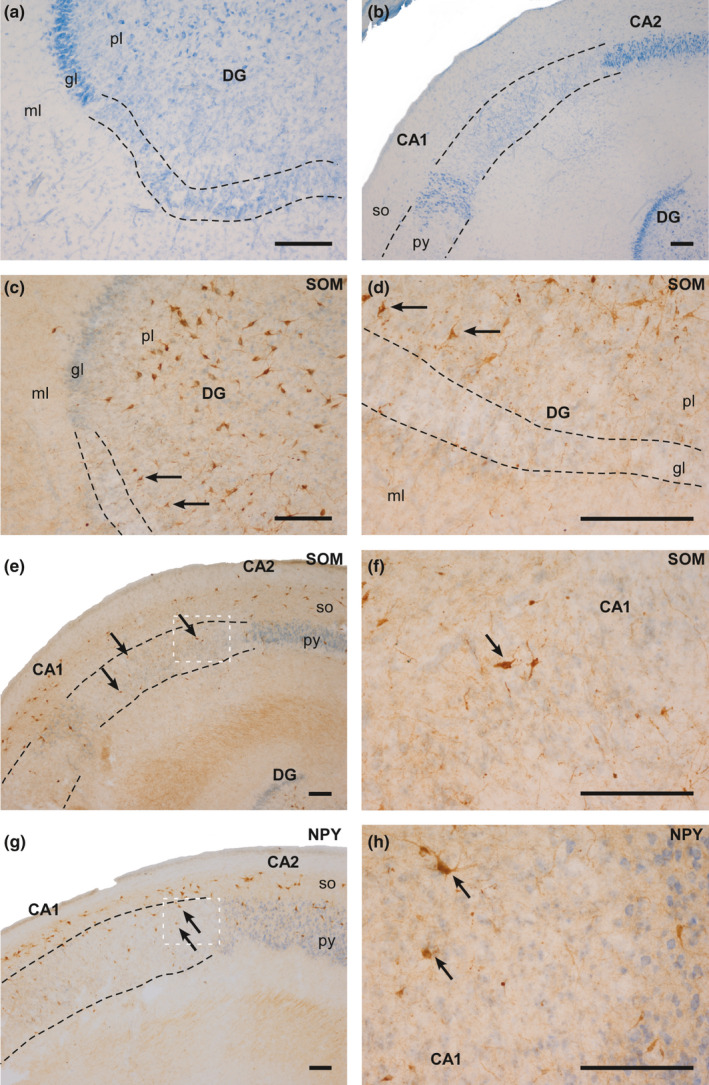
FIGURE 2.

Photographs of different fields of the hippocampus of case 6 (HYG). Clear cell loss can be observed (dashed line), mainly in the granular layer of the DG and in the pyramidal layer. (a and b): Nissl‐staining of DG (a) and ammonic fields (b). (c and d): SOM‐IR counterstained with thionin in the DG. The arrows indicate SOM‐IR cells in the polymorphic layer of the DG. (e): SOM‐IR counterstained with thionin in CA2 and CA1. The arrows indicate SOM‐IR cells in the pyramidal layer of CA1. (f): High‐power magnification of image (e). (g): NPY‐IR counterstained with thionin in CA2 and CA1. The arrows indicate NPY‐IR cells in the pyramidal layer of CA1. (h): High‐power magnification of image G. Abbreviations: DG: dentate gyrus; ml: molecular layer; gl: granular layer; pl: polymorphic layer; py: pyramidal layer; so: stratum oriens; CA1: ammonic hippocampal field 1; CA2: ammonic hippocampal field 2. Scale bar: 200 µm
