
FIGURE 4.
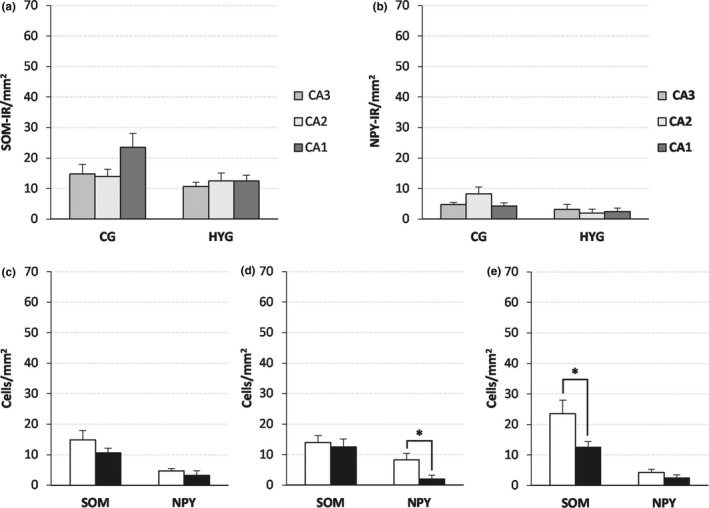
SOM‐IR and NPY‐IR cell density (mean ± SEM) in the pyramidal layer of the ammonic fields. (a and b) SOM‐IR (a) and NPY‐IR (b) cell density by groups. (c–e) SOM‐IR and NPY‐IR cell density by area, (c) CA3, (d) CA2, and (e) CA1. White bar: CG; black bar: HYG. Significance *: p < 0.05. Abbreviations: CG: control group. HYG: hypoxia–ischemia group