
FIGURE 5.
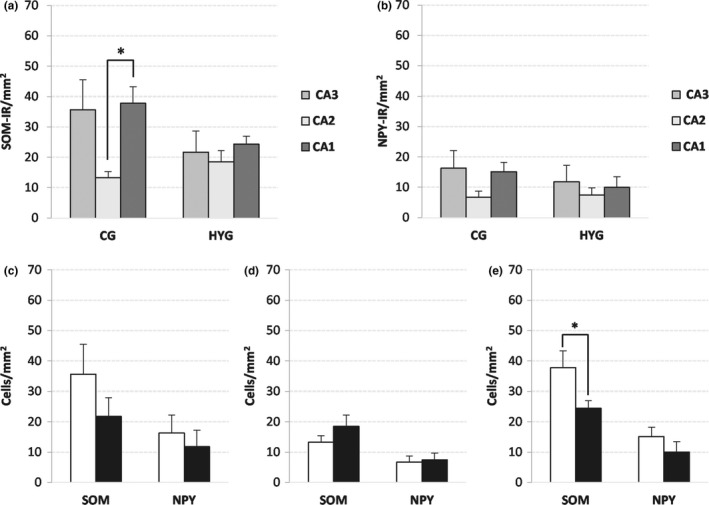
SOM‐IR and NPY‐IR cell density (mean ± SEM) in the stratum oriens. (a) and (b) SOM‐IR (a) and NPY‐IR (b) cell density by groups. (c–e) SOM‐IR and NPY‐IR cell density by area, (c) CA3, (d) CA2, and (e) CA1. White bar: CG; black bar: HYG. Significance *: p < 0.05. Abbreviations: CG: control group. HYG: hypoxia–ischemia group