
FIGURE 7.
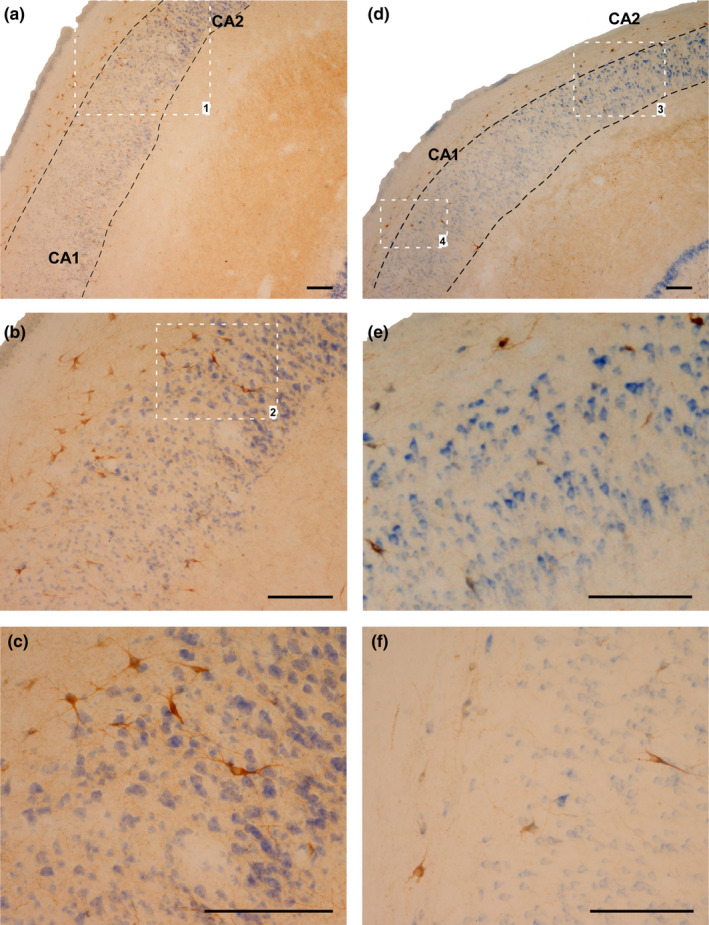
SOM‐IR cells in the stratum oriens and pyramidal layer of CA2 and CA1. (a–c) Case 2, CG. (b) Magnification of area limited by square 1 in (a). (c) Magnification of area limited by square 2 in (b). (d–e): Case 10 (HYG). (e): Magnification of area limited by square 3 in (a). (f): Magnification of area limited by square 4 in (a). Abbreviations: CA1: ammonic hippocampal field 1; CA2: ammonic hippocampal field. Scale bar: 200 µm