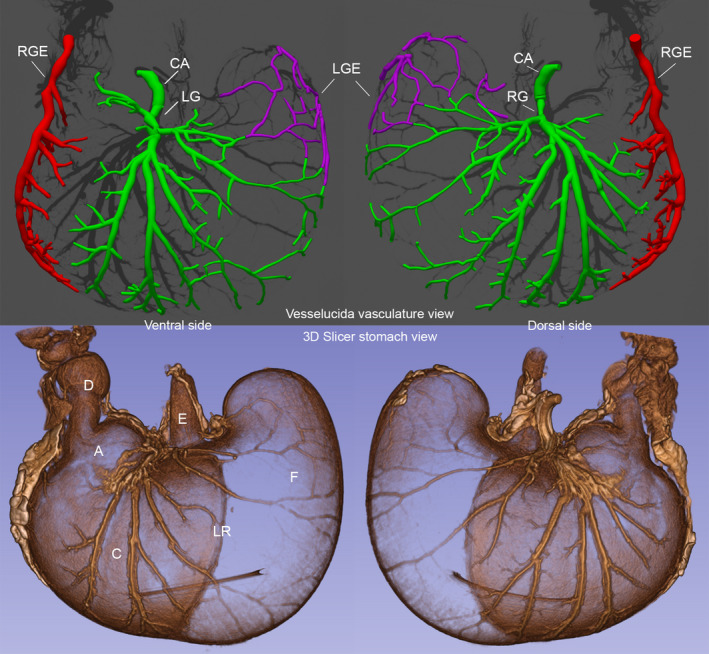
FIGURE 2.

The angioarchitecture profile of a fed rat (same animal as in Figure 1) stomach delineated with a Microfil® label and micro‐CT imaging. A post‐feeding delay of 0.5 hours occurred after a meal of 9.49‐g Dietgel Recovery® was consumed. Upper panel: profile on left is an exterior micro‐CT (55 kV; 144 µA; voxel size =90 µm) view of the ventral stomach arteries mapped and color designated with MBF Biosciences’ Vesselucida®, and the profile on the right is a comparable exterior view of the dorsal stomach arteries mapped and color designated with Vesselucida® of the same animal (3D image cropped to include just dorsal or ventral features). Lower panel: micro‐CT images (90 kV; 88 µA; voxel size =90 µm) of Iodine counterstained profiles of the stomach in the upper panel. Perspectives the same as in the upper panel. The profiles are 3D Slicer reconstructions of micro‐CT scan DICOM files, cropped to include just dorsal or ventral features. The figure was created by screen capture of the 3D Slicer and Vesselucida® images followed by import into Photoshop where images were resized with resampling as needed See also Data S2 for an animated 3D version. Labels: A: antrum; C: corpus; F: forestomach; LR: limiting ridge; E: esophagus; D: duodenum; CA; celiac artery; LG: left gastric artery; RG: right gastric artery; LGE: left gastroepiploic artery; RGE right gastroepiploic artery
