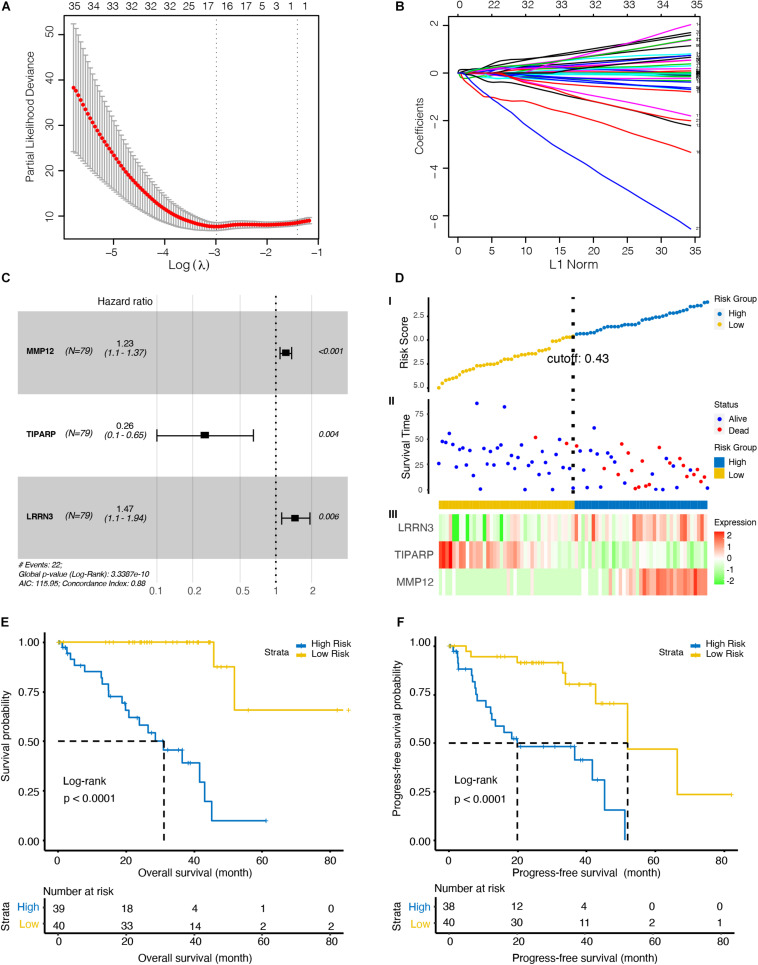
FIGURE 2.
Identification of an optimal marker model for prognostic prediction in the TCGA dataset UM patients. (A) 10-fold cross-validation for tuning parameter selection in the least absolute shrinkage and selection operator (LASSO) model. The first vertical line equals the minimum error (lambda = 0.05265), whereas the second vertical line shows the cross-validated error within one standard error of the minimum (lambda = 0.17646). (B) LASSO coefficient profiles of the fractions of 219 immune cell markers. Each curve corresponds to a variable. It shows the path of its coefficient against the L1-Norm of the whole coefficient vector as lambda varies. The axis above indicates the number of non-zero coefficients at the current lambda, which is the effective degrees of freedom (df) for the LASSO. (C) Forest plots showing associations between different immune cell markers and OS in the TCGA cohort. Unadjusted hazard ratios are shown with 95% confidence interval (CI). (D) Characteristics of the 3-gene pair prognostic signature. (top): the risk score of each UM patient; (middle): OS and survival status of UM patients; (bottom): heat map of gene expression profiles of UM patients in the TCGA cohort. (E) Kaplan–Meier curves for the OS of UM patients in high- and low-risk groups. (F) Kaplan–Meier curves for the progress-free survival (PFS) of UM patients in high- and low-risk groups.

