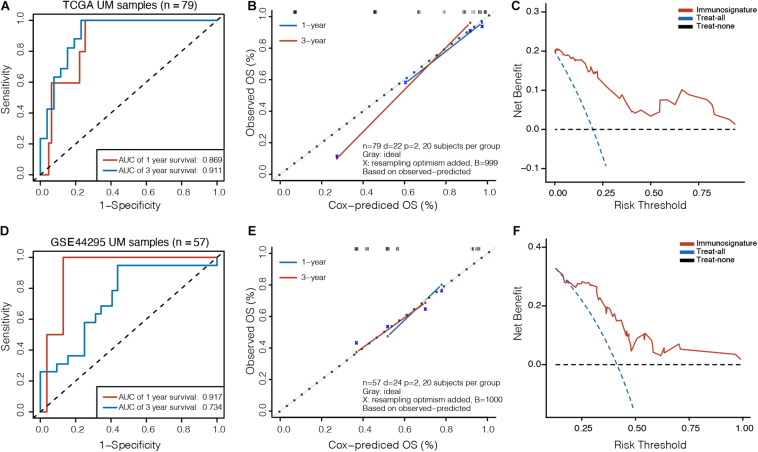
FIGURE 3.
Validation of prognostic model in UM. (A) Time-dependent receiver operating characteristic (ROC) curves, (B) calibration plots, and (C) decision curve analysis (DCA) for the OS predicted with the prognostic model in the TCGA cohort. (D) Time-dependent ROC curves, (E) calibration plots, and (F) DCA for the OS predicted with the prognostic model in the GSE44295 cohort. The x-axis of calibration plot is the immunosignature-predicted probability of OS, and the y-axis is the actual OS.

