Figure 1.
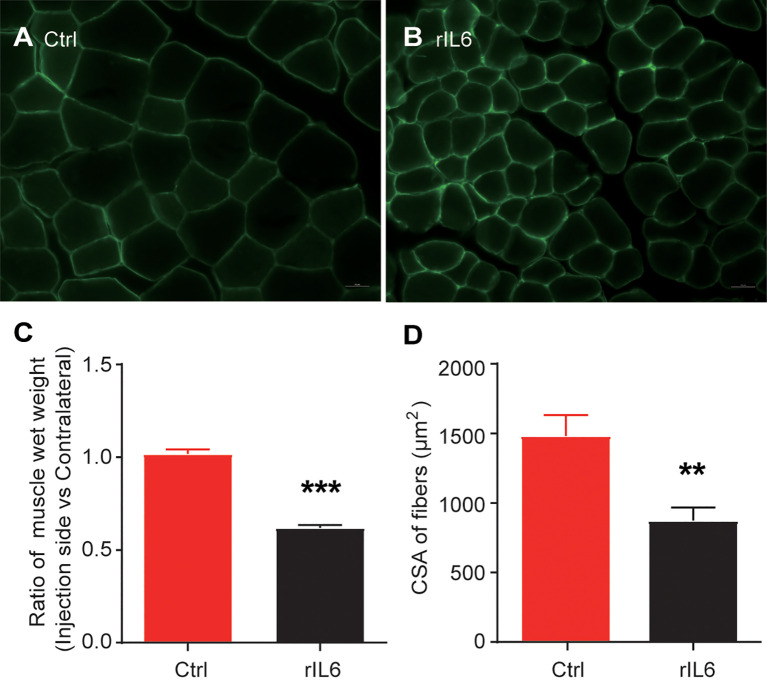
Interleukin-6 (IL-6) induces skeletal muscle atrophy. (A) Laminin immunohistochemical staining of the tibialis anterior muscle of mice in the control group (injected with phosphate-buffered saline); scale bars = 20 μm. (B) Laminin immunohistochemical staining of the tibialis anterior muscle. (C) Results of the skeletal muscle wet-weight ratio between the experimental group and the control group. (D) Results of the comparison of the cross-sectional muscle fiber area between the experimental group and the control group. Statistical results, the bar graph represents the mean ± standard error of the mean, T-test was used to calculate the P-values, n = 3, **P < 0.01, ***P < 0.001, experimental group vs. control group. CSA, cross-sectional area; Ctrl, control; IL-6, interleukin-6; rIL-6, recombinant interleukin-6.

