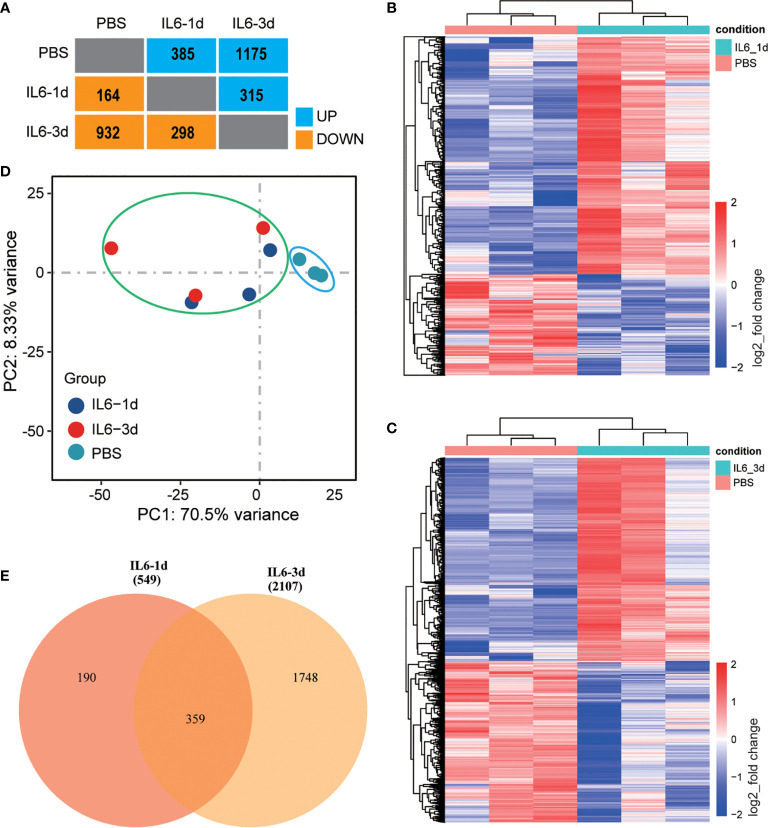
Figure 2.
Identification of differentially expressed genes (DEGs) in skeletal muscle after interleukin-6 (IL-6) infusion. (A) A summary of the number of DEGs after one and three days of IL-6 infusion in the intervention group compared with the control group. Blue indicates up-regulated genes, and orange indicates down-regulated genes. (B, C) Heat maps of all differentially expressed genes after one day (B) and three days (C) of IL-6 infusion. Red indicates up-regulated expression, and blue indicates down-regulated expression. (D) Principal component analysis of a single-sequencing sample. The shorter the sample clustering distance, the more similar the samples. The control group is marked by a blue ellipse and the experimental group by a green ellipse. (E) VENNY diagram of the overlap of DEGs after one and three days of IL-6 infusion. IL-6, interleukin-6; PBS, phosphate-buffered saline.

