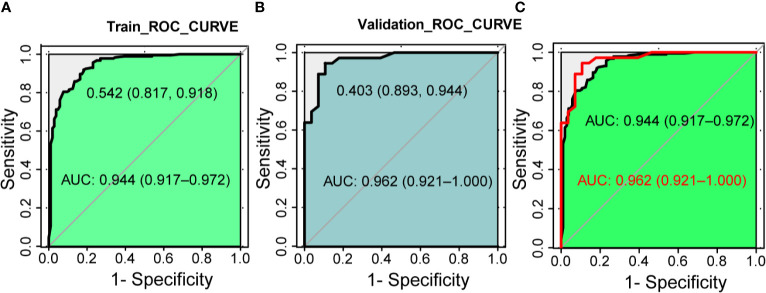
Figure 4.
The discrimination test of nomogram model (ROC analysis). (A) The area under the AUC of the training set is 0.944(95%CI 0.917~0.972, P < 0.001), the best diagnostic threshold is 0.542. (B) The AUC of the validation set is 0.962 (95% CI 0.921~1.000, P < 0.001), the best diagnostic cut-off value is 0.403. (C) Combination of panels (A, B). AUC, the area under the receiver operating characteristic curve; ROC, the receiver operating characteristic.

