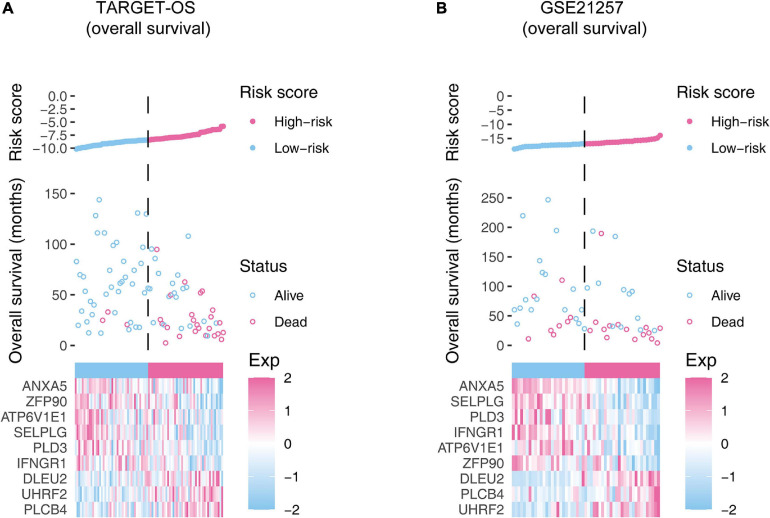
FIGURE 4.
The overall distributions of the risk score (upper), survival status (middle), and gene expression profiles (bottom) of the nine-gene signature in the training (A) and validation (B) cohorts. The top parts show the distributions of the risk score. The center parts show the distributions of the patient survival time and status. The bottom parts indicate heatmaps of the nine gene expression profiles.

