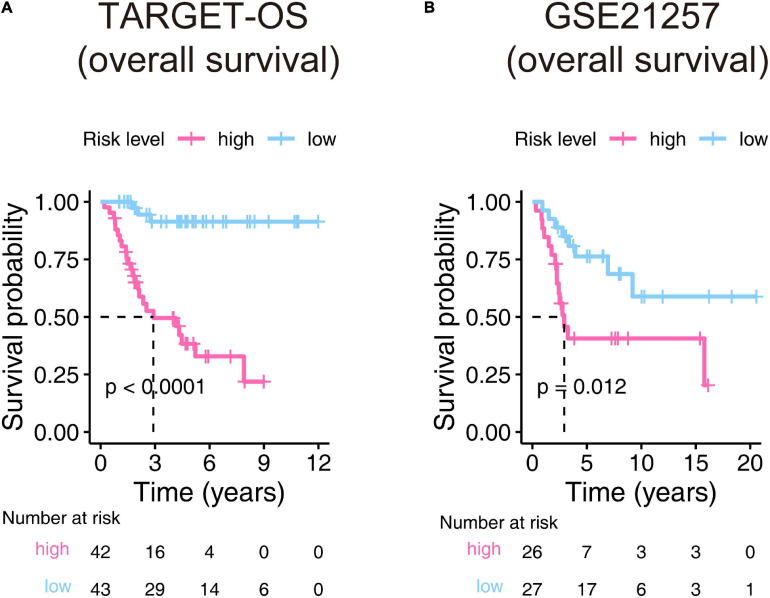
FIGURE 5.
Kaplan–Meier estimator evaluates the nine-gene signature’s prognostic capacity in the training (A) and validation (B) cohorts. The bottom parts indicate the number of patients at risk. The two-sided log-rank test measured the differences between the high- and low-risk groups with a p-value < 0.05.

