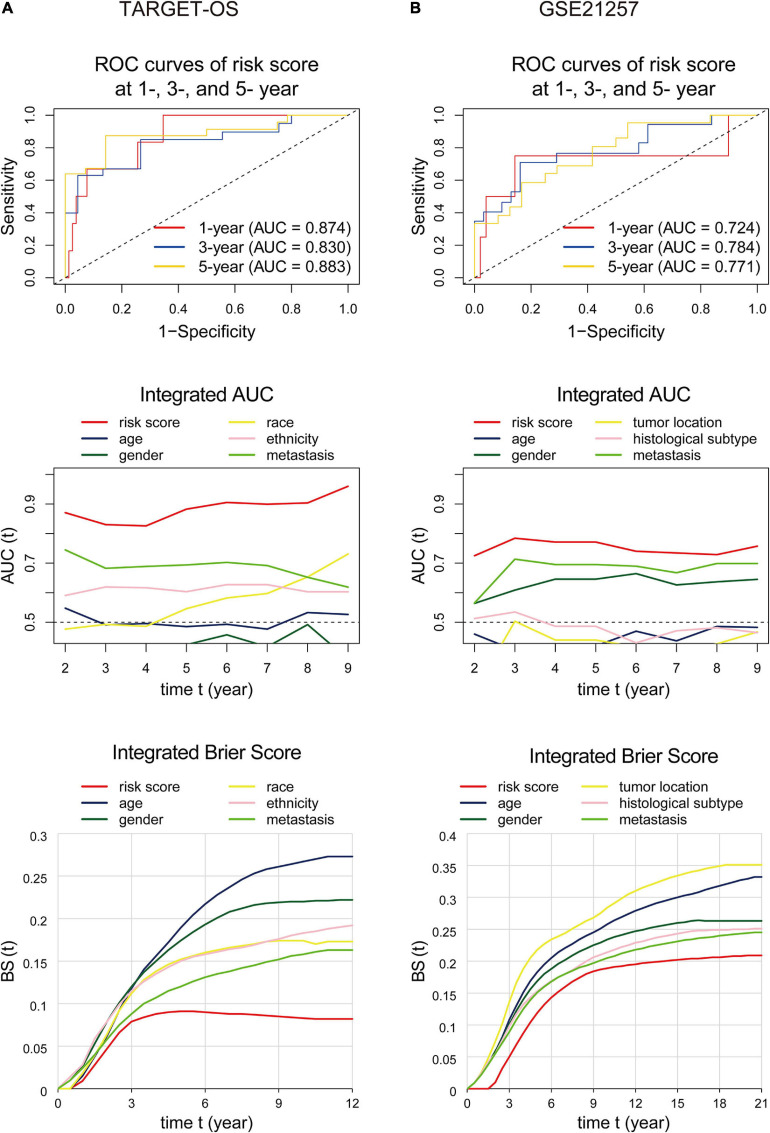
FIGURE 7.
ROC curves, integrated AUC analysis, and integrated Brier score analysis performed to examine the predictive ability of the nine-gene signature in the training (A) and validation (B) cohorts. The ROC curvesdisplay prognostic capacities with the nine-gene signature at 1-, 3-, and 5-year time points. The integrated AUC and integrated Brier score analysis show the predictive ability comparisons between the nine-gene signature and other clinical factors. ROC, receiver operating characteristic; AUC, area under the ROC curve.

