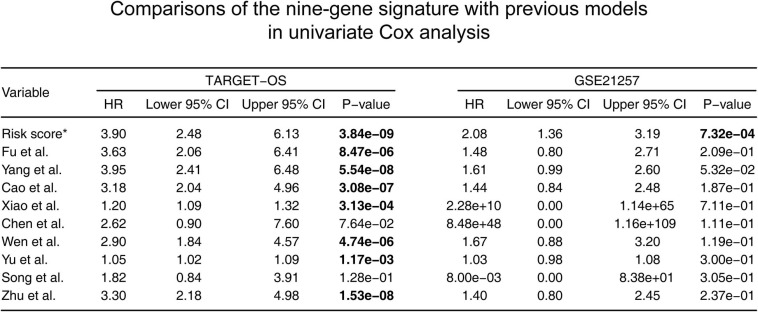
FIGURE 9.
Comparisons between the nine-gene signature and previous studies conducted in the training and validation cohorts using the univariate Cox proportionalhazards model. HR, hazard ratio; CI, confidence interval. *: the nine-gene signature identified in this study; the bold p-value indicates that<0.05, which is considered significant.

