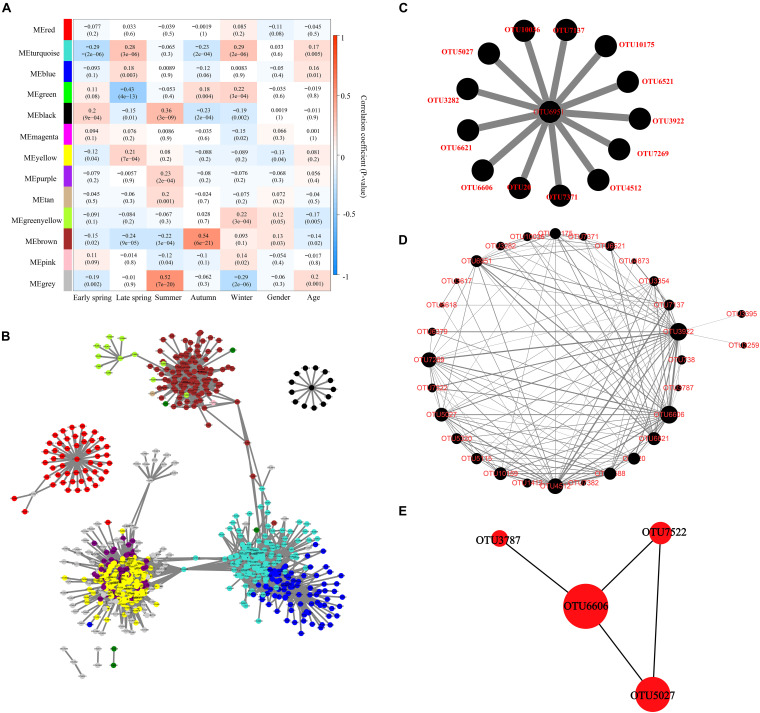
FIGURE 5.
Identification of key module and hub OTUs based on WGCNA. (A) Correlation between module eigenvalue and traits of musk deer. Depth of color corresponds to depth of correlation and p-value of each module presented in parentheses. (B) Network diagram of the hub OTUs. Each node represented the OTUs whose Ktotal value was in the top 10%, and its color represented the corresponding module. The gray line thickness represents the weight value between nodes (OTUs). (C) Visualization of hub OTUs in black modules. (D) Visualization of full weighted networks in black modules associated with different seasons. The node size represented the Kwithin value of the node in the black module, that is, the size of the connectivity in the module. The gray line thickness represented the weight value between nodes (OTUs). (E) Identification of key OTU in the black module through Cytohubba. The node size represented the Kwithin value, and the shade of red indicated the importance within the module.

