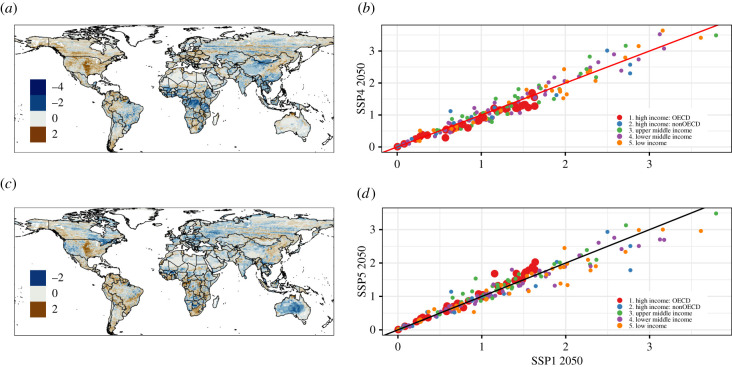
Figure 4.
Hazard index predicted for 2050. (a) The pathway deepening inequality scenario 2050 compared with the sustainable future scenario 2050 (SSP4–SSP1). (b) Scatter plot of the hazard index according to countries classified by five classes of economies. Circles above the black line indicate an increase in hazard in SSP4, while circles below the black line indicate an increase in hazard in SSP1. (c) The fossil-fuelled development scenario 2050 compared with the sustainable future scenario 2050 (SSP5–SSP1). (d) Scatter plot of the hazard index according to countries classified by five classes of economies. Circles above the black line indicate an increase in hazard in SSP5, while circles below the black line indicate an increase in hazard in SSP1. In both scatter plots, countries are corrected per area.

