
Figure 2.
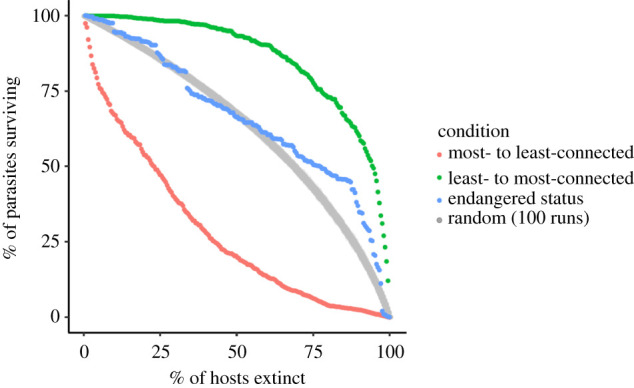
Patterns of secondary extinction under different scenarios of host loss. For the random extinction scenario, points for 100 runs are plotted together to illustrate the range of observed values, with an offset of 0.5 units on the horizontal axis to allow visualization of overlapping points.