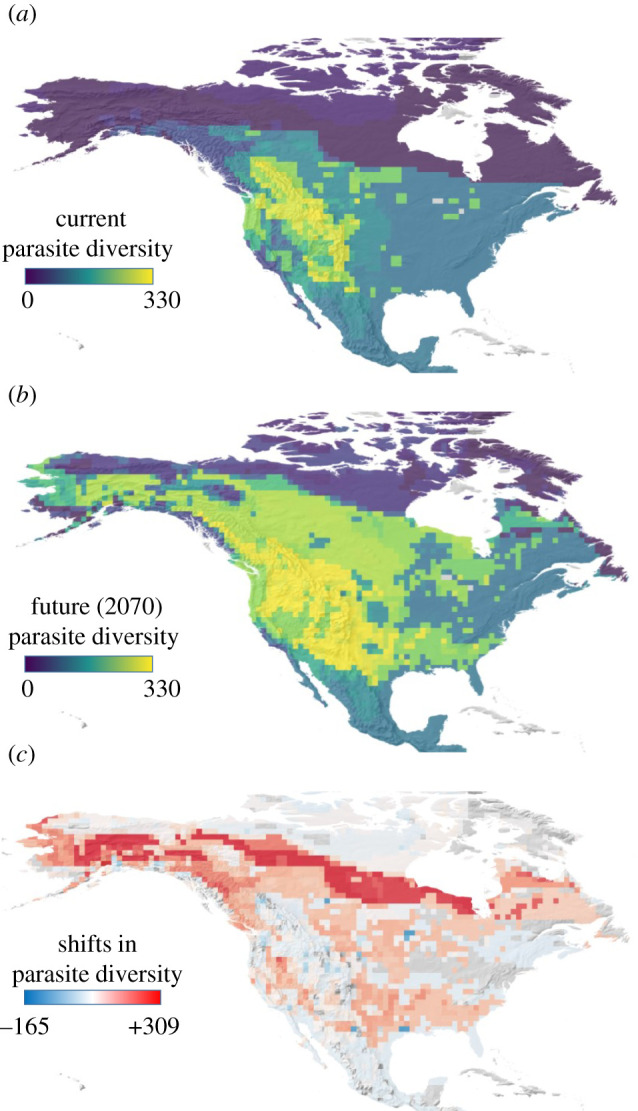
Figure 2.

Maps of species richness and shifts in species richness of parasites infecting ungulate hosts in North America. Species richness of parasites is calculated by summing the number of unique parasites across all co-occurring ungulate hosts using the information on contemporary (a) and future projected distributions of hosts (b) with climate change. Mapping assumes parasites are evenly distributed across the entire range of their hosts, which is likely unrealistic [64,65], but we use this simplifying assumption here for illustration. Forecasted shifts in species richness of parasites due to climate change (c) are computed as the difference between contemporary (data compiled in the Global Parasite Mammal Database up to 2010) parasite richness and parasite richness after host range shifts (distributions for the year 2070 under Representative Concentration Pathway 8.5).
