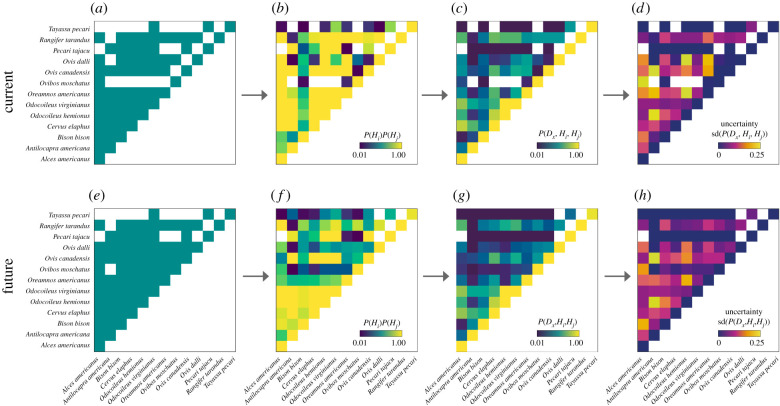
Figure 3.
Sequential calculation of pairwise parasite sharing among North American ungulate hosts. The framework starts by fitting models for co-occurrence among pairs of ungulate hosts according to their contemporary (a,b) and forecasted (e,f) future distributions for the year 2070 under RCP 8.5; (a,e) show the networks computed based on binary distributions of hosts (co-occurring hosts are marked in green). The next column to the right (b,f) shows the joint probability with which each pair of hosts co-occurs. Joint probabilities shown here are summarized across the study area as the upper quartile of sites where each host from a host pair has a non-zero probability of occurrence. The framework finishes by fitting models of parasite sharing for current (c) and forecasted (g) co-occurrence among ungulate hosts and each parasite in the dataset, here illustrated with an Orbivirus (blue tongue disease). Example of modelled predictions corresponds to averaged probabilities across 50 iterations of the parasite sharing model. Uncertainty around predicted probabilities is also reported for current (d) and future (h) host co-occurrence. Note that this same figure can be reproduced for all other parasites in the dataset. (Online version in colour.)

