Figure 3.
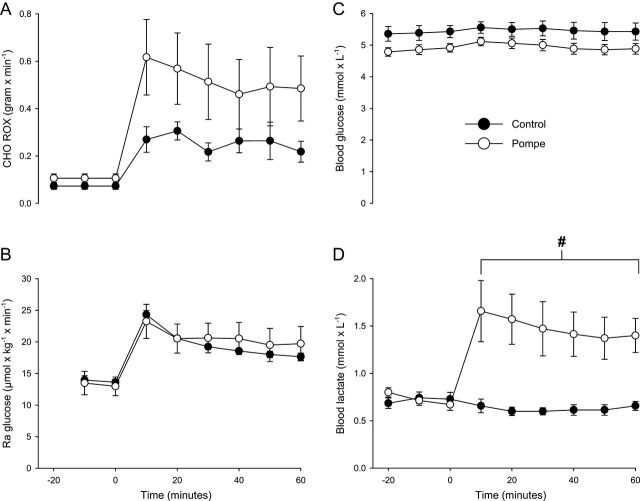
Carbohydrate metabolism and blood lactate levels during submaximal exercise. (A) The whole-body carbohydrate (CHO) rate of oxidation (ROX) was similar between patients and controls during exercise; mean difference 0.226 g/min (CI: 0.611 to −0.078, P = 0.318). (B) The rate of appearance of glucose (Ra), i.e. liver glucose output, was also similar between patients 20.7 (s.d. 6.6) and controls 19.6 (s.d. 1.2) µmol/kg/min, respectively, during exercise; mean difference 1.1 µmol/kg/min (CI: 6.7 to −4.4, P = 0.902). (C) Blood glucose levels during exercise remained stable in patients 5.0 (s.d. 0.4; range: 4.5–5.6) and controls 5.5 (s.d. 0.6; range: 5.0–6.8) mmol/L, and there was no difference in blood glucose levels between groups (P = 0.128). (D) Blood lactate levels did not increase during exercise in controls; however, in the patients, the blood lactate levels rose significantly to a mean of 1.5 (s.d. 0.6) vs 0.6 (s.d. 0.1) mmol/L in controls; mean difference 0.9 mmol/L (CI: 0.3–1.4, P = 0.001). Error bars are s.e.m. #significantly different from controls during exercise P < 0.05 (mean of whole exercise period).

 This work is licensed under a