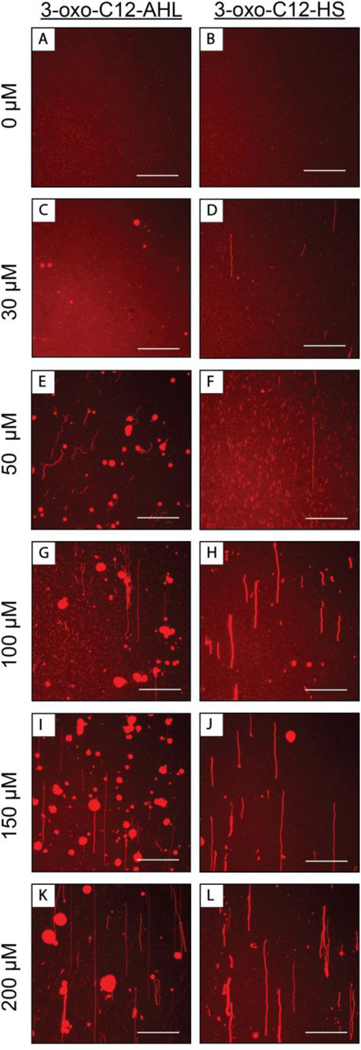
Figure 4:
Representative top-down fluorescence micrographs of fluorescently labeled DOPC SLBs that are either (A, B) stable under a continuous flow of buffer or (C-L) have undergone structural reformations after interacting with a continuous flow of (left images: C, E, G, I, K) 3-oxo-C12-AHL or (right images: D, F, H, J, L) 3-oxo-C12-HS solutions. Images were acquired 360 seconds after the onset of membrane restructuring. The concentration of amphiphiles used in each experiment were (C,D) 30 μM, (E,F) 50 μM, (G,H) 100 μM, (I,J) 150 μM, or (K,L) 200 μM. The direction of flow in all images was from the bottom to the top of the image. Scale bars are 30 μm.

