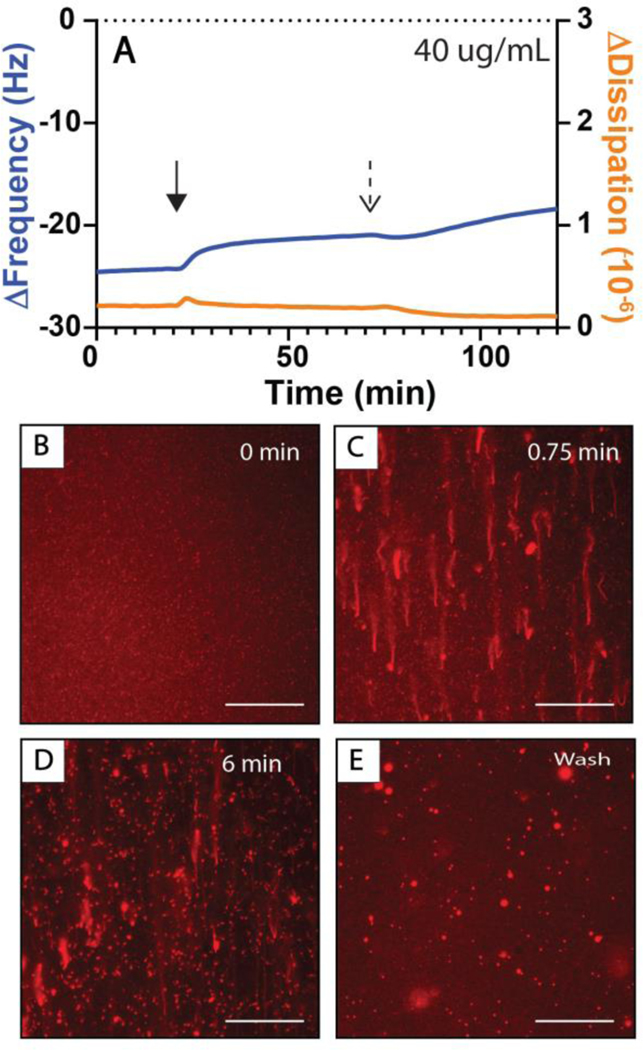
Figure 6:
Measurements of membrane restructuring occurring in DOPC SLBs introduced to 40 μg/mL solutions of rhamnolipid. (A) QCM-D measurements of bilayer reformations initiated by the introduction of rhamnolipid solutions with changes in frequency (ΔFrequency, blue lines; referred to as Δf in the main text for brevity), and dissipation (ΔDissipation, orange lines; referred to as ΔD in the main text for brevity) shown are representative of three or four independent experiments. The initial measurement values (t=0 min) of these experiments correspond to a DOPC SLB on an SiO2 surface. Rhamnolipid solutions were introduced to the bilayer at the time indicated by the solid arrow and the buffer was introduced at the time indicated by the dashed arrow. (B-E) fluorescence micrographs of bilayer restructuring occurring at (B) 0 sec, (C) 45 sec, and (D) 6 min after the first bilayer restructuring events had been observed or (E) after at least 8 minutes of washing the bilayer with buffer. The direction of flow in all images is from the bottom to the top of the image. Scale bars are 30 μm.

