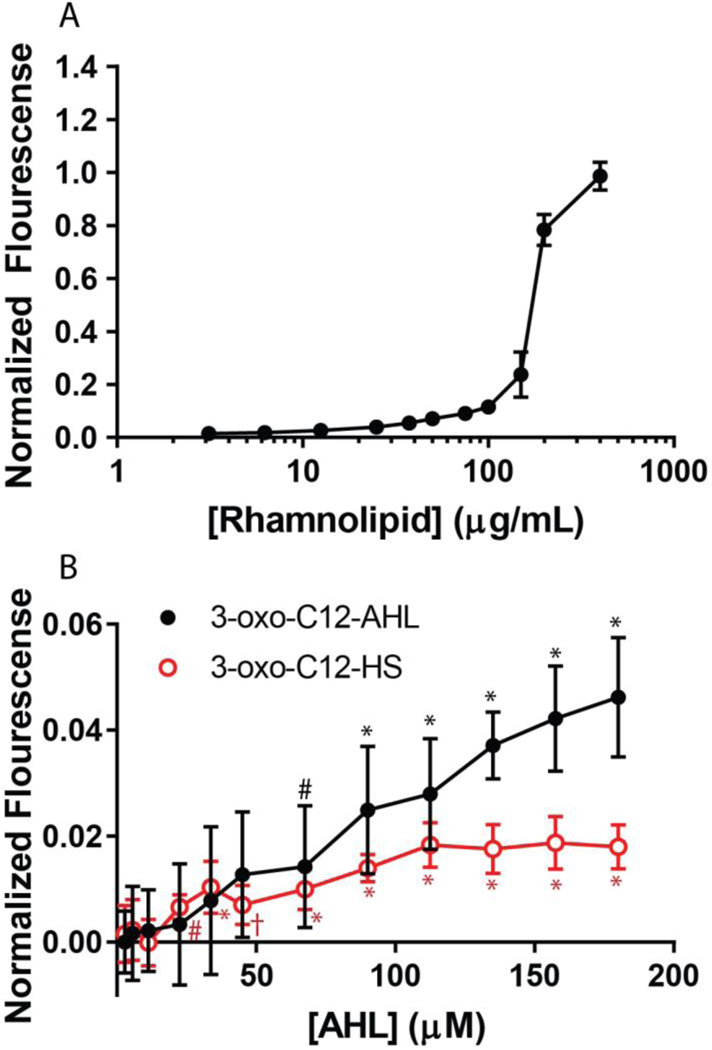
Figure 8:
Normalized calcein fluorescence intensity values of (A) rhamnolipid and (B) 3-oxo-C12-AHL (black circles) and 3-oxo-C12-HS (red squares) at various concentrations interacting with 100 μM of calcein-loaded DOPC vesicles. Statistical significance compared to a buffer control is indicated for concentrations of 3-oxo-C12-AHL (black asterisks) and 3-oxo-C12-HS (red asterisks), with the following p values: #p<0.05, †p<0.01, *p<0.0001. All points shown are the average and standard deviation of nine independent fluorescence measurements (see Materials and Methods). For the rhamnolipid measurements, some error bars are obscured by the size of the data point.

