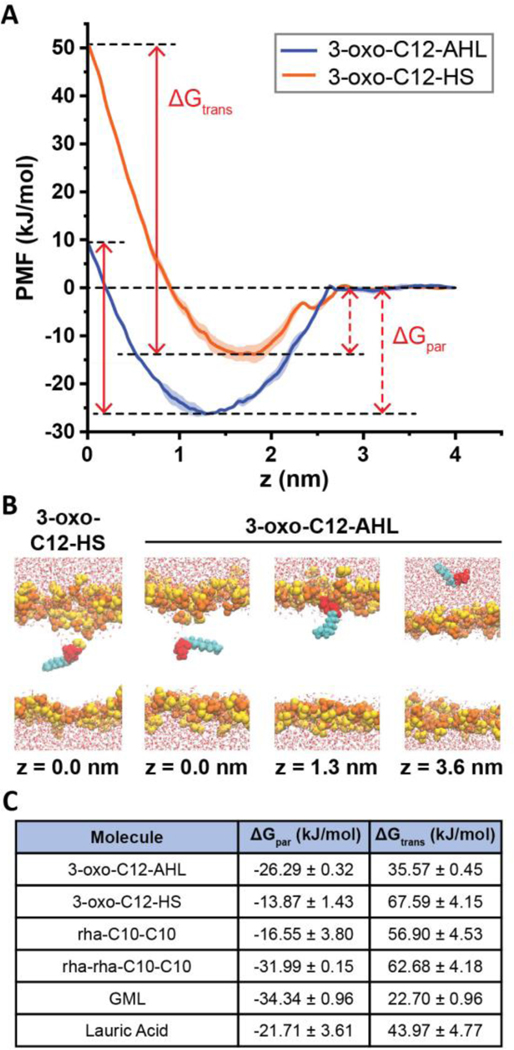
Figure 9:
Results of molecular dynamics simulations. (A) Potentials of mean force (PMFs) of 3-oxo-C12-AHL (blue) and 3-oxo-C12-HS (orange) as a function of the distance along the DOPC bilayer normal (z). The midplane of the membrane is at z = 0 nm and the PMF is set to zero at z = 4 nm. Each curve shows the average of two independent PMFs and error bars show the standard deviation. The plots also illustrate the definition of ΔGpar as the free energy difference between the PMF minimum and the value in solution and ΔGtrans as the free energy difference between the PMF minimum and maximum. (B) Snapshots showing configurations of AHLs and bilayers for different characteristic values of z in the PMF of 3-oxo-C12-AHL. A snapshot for z = 0 nm for 3-oxo-C12-HS is shown to highlight the local bilayer disruption that contributes to the larger value of ΔGtrans. Lipid head groups are yellow/orange, AHL heads are red, AHL tail groups are cyan, and water is drawn as red and white. Lipid tail groups are not shown for clarity. (C) Table showing ΔGpar and ΔGtrans values for all molecules simulated here.

