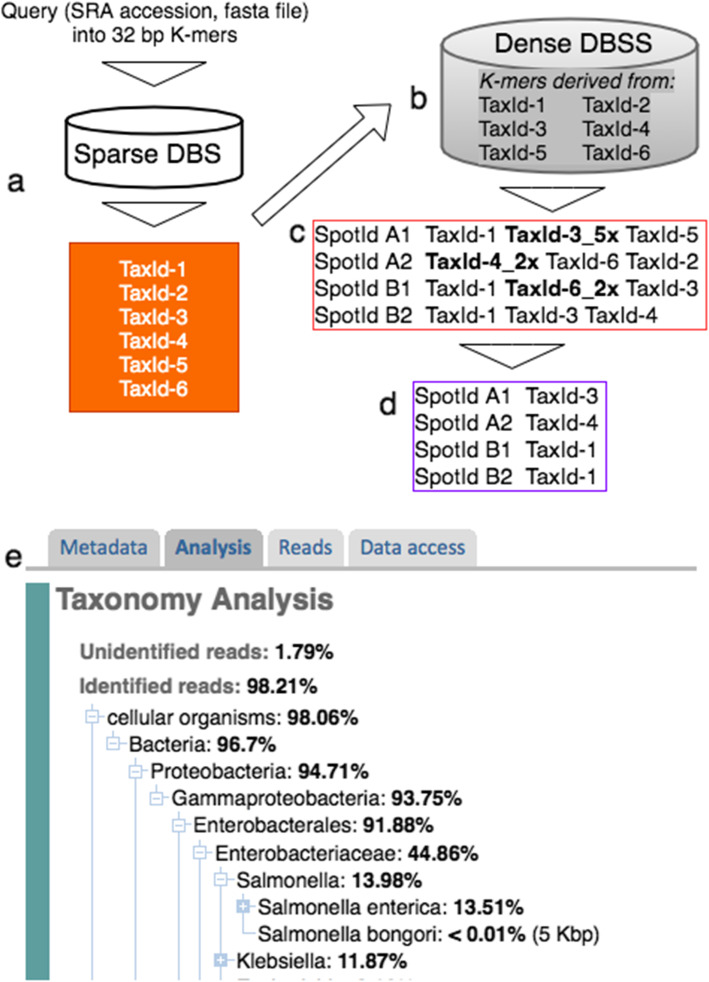
Fig. 3.
STAT two phase query. a In the first qualitative phase the input query (an SRA accession, or fasta file) is sequentially rendered into 32 bp k-mers, and matches to the decimal values found in the sparse database identifying taxa for deeper analysis. b TaxIds identified in a are used to select the densely sampled k-mers derived from those taxa, then the same query is used in a second quantitative pass. c Bordered in red is the immediate STAT output consisting of one line for each spot with hits, each followed by one or more TaxIds matching that spot. Examples of more than one hit for a TaxId are shown in bold. d The first post processing output bordered in purple depicts the result of resolving each spot in c to a single taxon. e The final processing step resolves the run composition from the spots resolved in d, and an example from our public display using that result is shown

