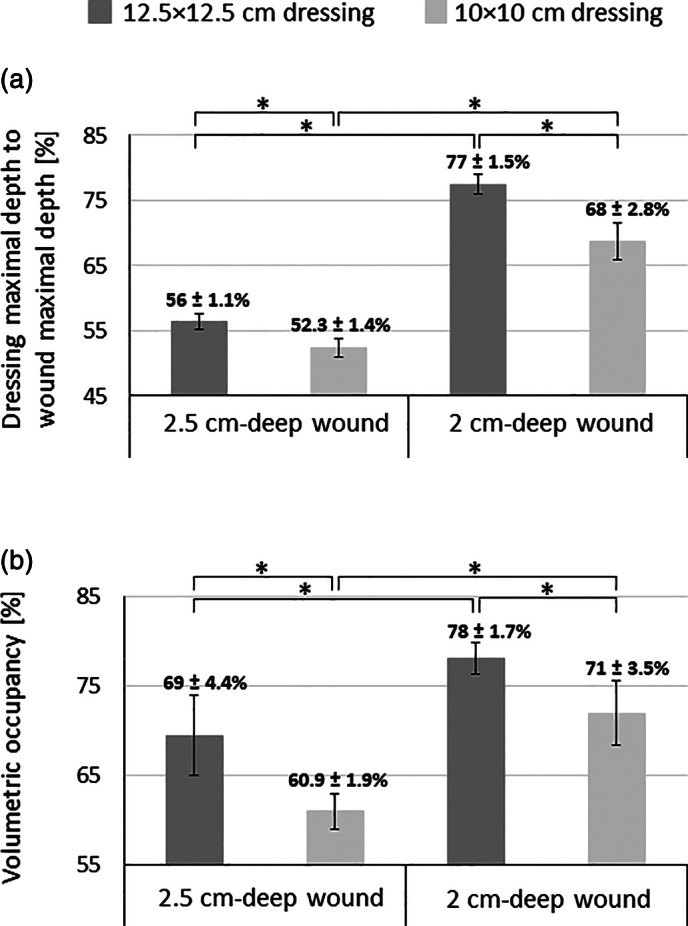
FIGURE 3.

Dressing maximal depth to (simulated) wound maximal depth ratio (%) (A) and the volumetric occupancy of the dressing in the wound cavity [%] (B) for the two studied wound depths and two dressing sizes (N = 5 test repetition for each outcome measure). The error bars are the SD from the mean. Asterisks indicate a statistically significant difference between a pair of means (P < .05)
