
FIGURE 3.
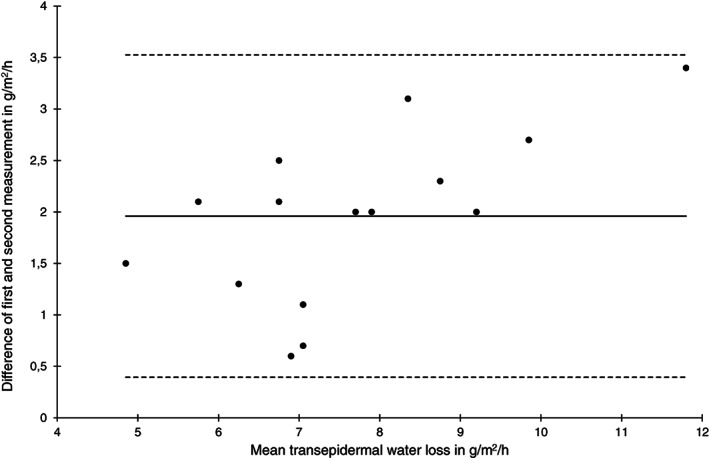
Bland‐Altman plot of transepidermal water loss measurements at the sacral skin area at baseline (n = 15)
Official websites use .gov
A
.gov website belongs to an official
government organization in the United States.
Secure .gov websites use HTTPS
A lock (
) or https:// means you've safely
connected to the .gov website. Share sensitive
information only on official, secure websites.
Bland‐Altman plot of transepidermal water loss measurements at the sacral skin area at baseline (n = 15)