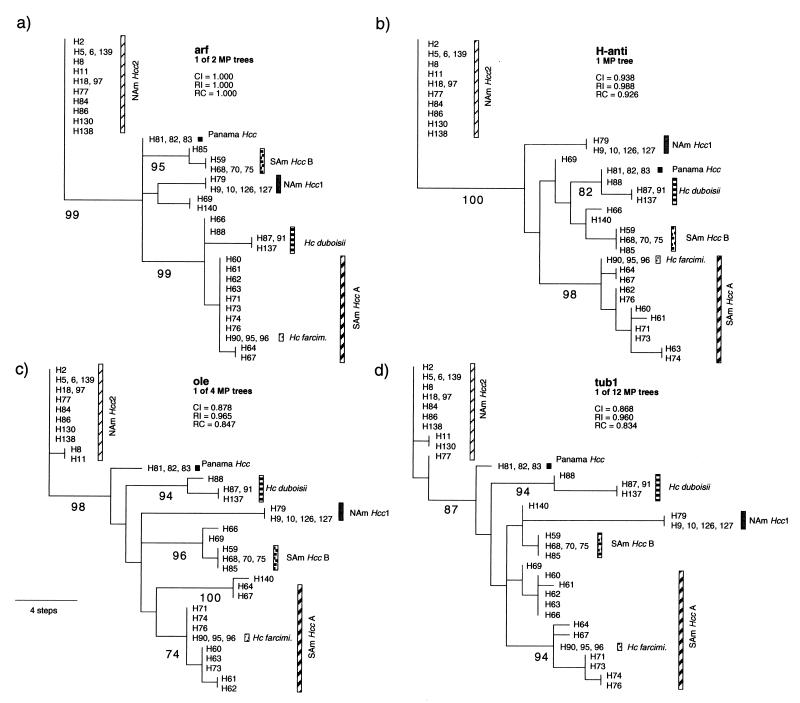
FIG. 2.
A single MP tree resulting from analysis of DNA sequences of the 33 multilocus genotypes from each of the four gene regions sequenced. Isolates with an identical genotype are shown together with the representative isolate for each of the 33 genotypes. CI, consistency index; RI, retention index; RC, rescaled consistency index. Numbers below branches represent indices of support based on 500 bootstrap replications of the parsimony procedure. Only values ≥70% are shown. Branch lengths are proportional to the numbers of changes in informative characters between nodes (scale at the lower left). SAm Hcc A, South American H. capsulatum group A; SAm Hcc B, South American H. capsulatum group B; Hc farcimi., H. capsulatum farciminosum. Abbreviations of other groups are listed in Table 1.

