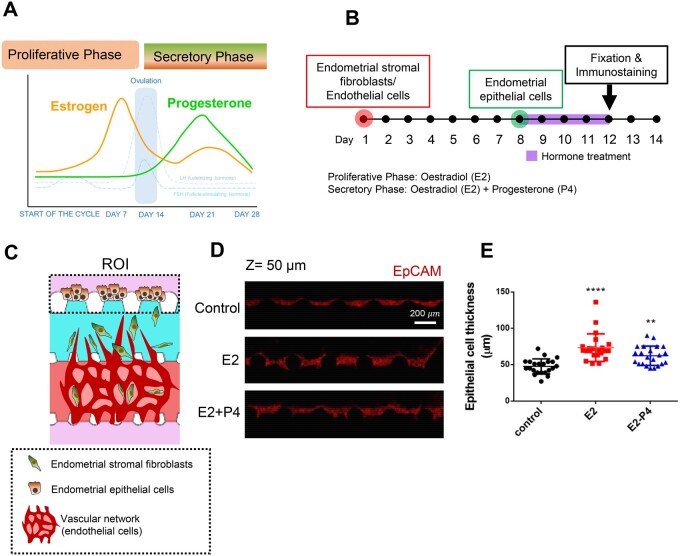
Figure 2.
Endometrial epithelial cell responses under proliferative and secretory phase conditions. (A) Schematic of the female menstrual cycle showing contribution of the different hormones (oestrogen (E2) and progesterone (P4)). (B) Schematic of the experimental process. (C) Schematic illustration shows endometrial epithelial cell growth within microfluidic platform. (D) Representative confocal microscopic images of endometrial epithelial cells. Scale bar, 200 μm. (E) Quantification of endometrial epithelial cell thickness difference in response to E2 and E2+P4 treatment. One-way ANOVA, plotted as mean ± SEM; ** P < 0.01, **** P < 0.0001.

