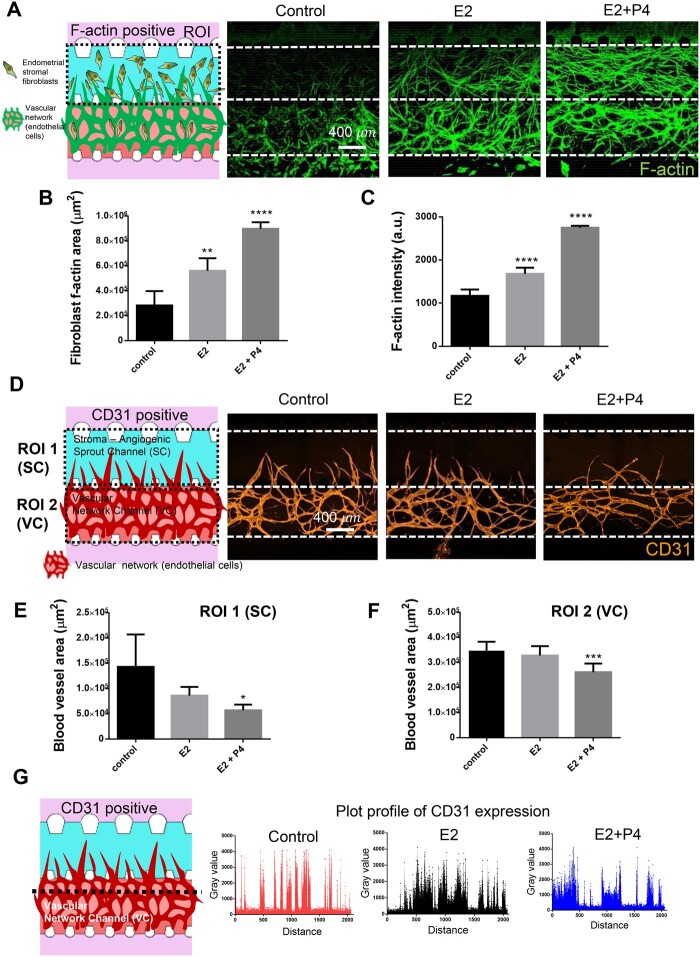
Figure 3.
Oestradiol and progesterone response of endometrial stromal fibroblasts and endothelial cells within 3D endometrium on a chip. (A) Schematic illustration and representative confocal images of F-actin cytoskeleton of endometrial stromal fibroblasts. Scale bar, 400 μm. (B) F-actin cytoskeleton area of endometrial stromal fibroblasts. (C) F-actin intensity of endometrial stromal fibroblasts. (D) Schematic illustration and representative confocal image of angiogenic sprouts and vascular network. Scale bar, 400 μm. (E) Angiogenic sprouts area in stroma-angiogenic sprout channel. (F) Vascular network area in vascular network channel. (G) CD31-positive plot profile of arbitrary transverse line one-way ANOVA, plotted as mean ± SEM; *P < 0.05, **P < 0.01, ***P < 0.001, and ****P < 0.0001.

