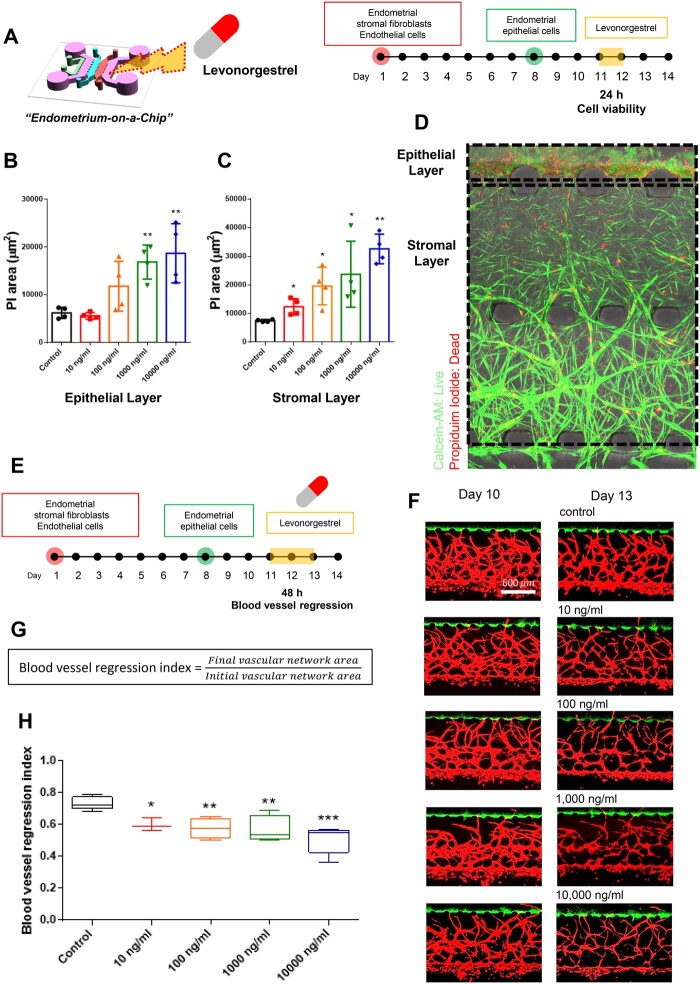
Figure 4.
Levonorgestrel response in 3D endometrium-on-a-chip. (A) Schematic illustration of levonorgestrel treatment on 3D endometrium-on-a-chip. (B and C) Propidium iodide area of the epithelium layer and stromal layer, respectively. (D) Representative confocal images represent live/dead signals. (E) Schematic illustration of levonorgestrel treatment on 3D endometrium-on-a-chip and blood vessel regression monitoring. (F) Representative confocal image of angiogenic sprouts and vascular network before levonorgestrel treatment (Day 10) and after levonorgestrel treatment (Day 13). Scale bar, 600 μm. (G) Blood vessel regression index was calculated as the ratio of final vascular network area to initial vascular network area. (H) Blood vessel regression index in response to different levonorgestrel dosages from 0 to 10 000 ng/ml. One-way ANOVA, plotted as mean ± SEM; * P < 0.05, ** P < 0.01, and *** P < 0.001.

