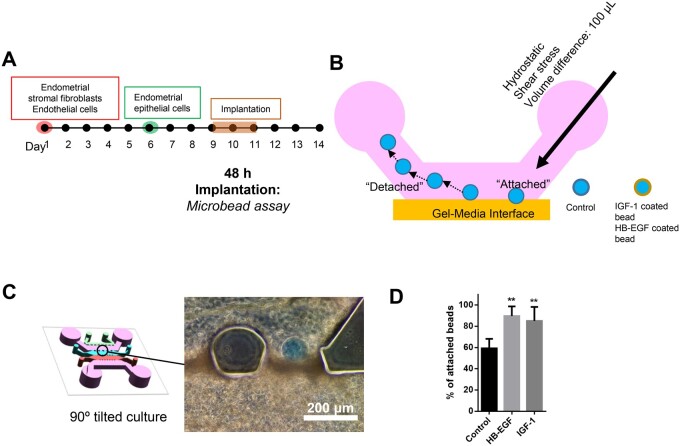
Figure 6.
3D microengineered implantation model. (A and B) Schematic of the experimental process of testing the 3D microengineered implantation model. (C) Bright field image of stably attached protein-coated microbeads. Scale bar: 200 μm. (D) Graph shows that beads carrying HB-EGF and IGF-1 exhibited significantly higher attachment than BSA-coated microbeads. One-way ANOVA, plotted as mean ± SEM; ** P < 0.01.

