Figure 2.

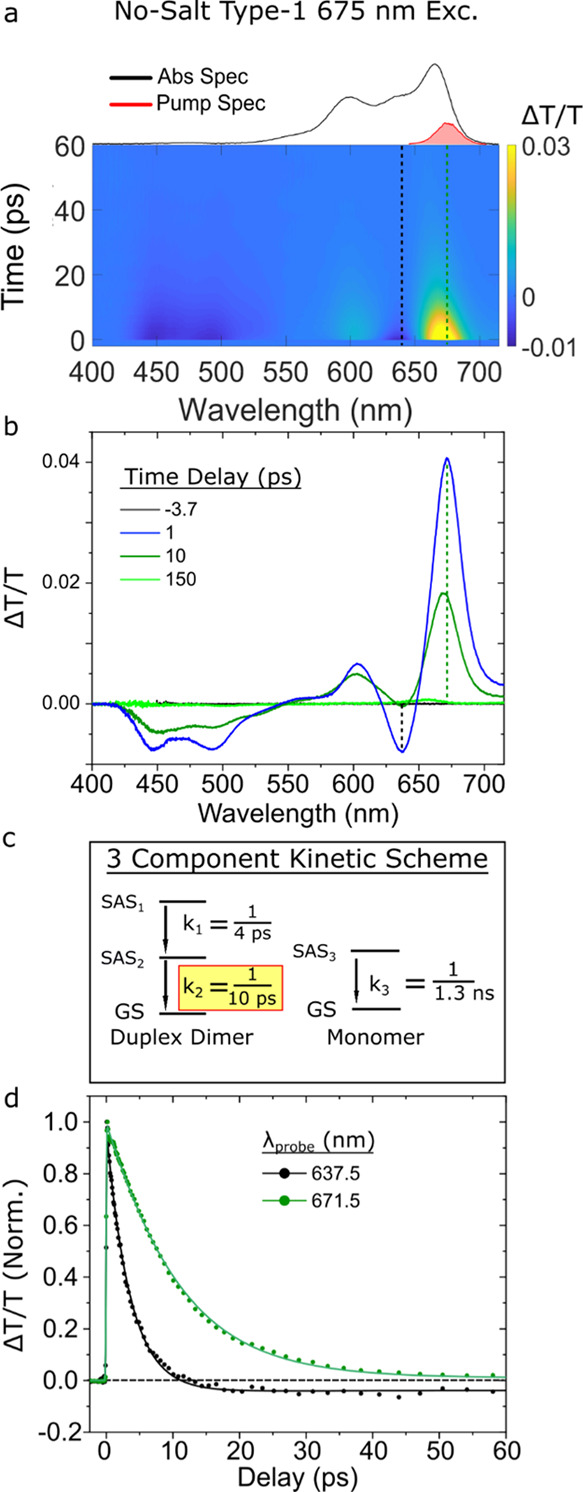
Femtosecond TA spectrum of the no-salt type 1 solution, predominantly composed of duplex J-dimer structures, collected with a pump wavelength of 675 nm at a fluence of 18 μJ/cm2. (a) Surface plot. The black and green vertical dashed lines correspond to individual kinetics traces plotted in panel (d). The absorption and pump spectra are plotted above the TA surface plot. The scale bar is indicated beside the plot. (b) Selected TA spectra. Time delays are indicated in the legend. (c) Kinetic scheme used to model the TA spectrum via GTA. Rate constants (expressed as inverse time constants) associated with conversion between different components exhibiting distinct species-associated spectra (SAS) are shown. The rate constant associated with the excited-state lifetime of the duplex dimer structure is highlighted in yellow. (d) Selected TA kinetics at probe wavelengths of 638 and 672 nm are shown, with the kinetics normalized to their maximum amplitude near the time origin of the measurement. Data are shown as circles, while fits are shown as solid lines.
