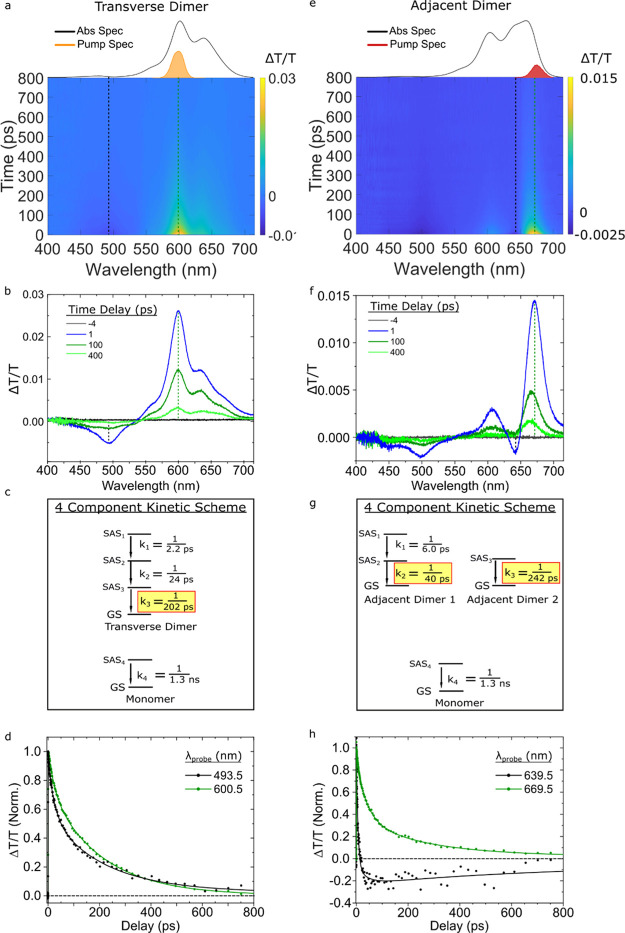
Figure 5.
Femtosecond TA spectra of the type 2 transverse and adjacent dimer solutions pumped at 600 and 675 nm, respectively, with pump fluences of 13 and 15 μJ/cm2, respectively. (a,e) TA surface plots of the transverse and adjacent dimer solutions. Vertical dashed lines indicate selected kinetics traces plotted in panels (d,h). (b,f) Selected TA spectra. (c,g) Kinetic schemes used for GTA. The rate constants associated with specific components and SAS are reported as inverse time constants. In both analyses, the rate constant associated with the monomer was fixed to 1/1.3 ns–1. (d,h) Normalized kinetics traces taken at different probe wavelengths. Data are shown as circles, while fits are shown as solid lines. In panel (d), kinetics traces are displayed for probe wavelengths of 494 and 601 nm, which correspond to ESA and GSB bands, respectively. In panel (h), kinetics traces are displayed for probe wavelengths of 640 and 670 nm, which correspond to ESA and overlapping ESA and GSB bands, respectively.

