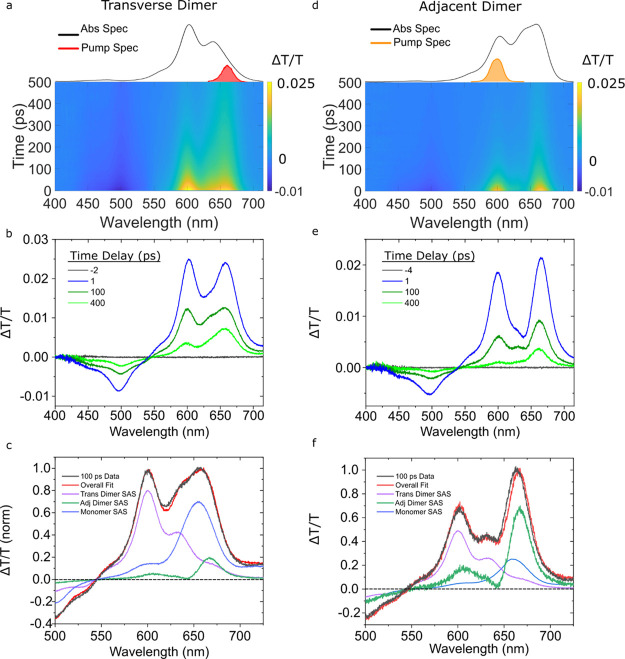
Figure 6.
Femtosecond TA spectra of the type 2 transverse and adjacent dimer solutions pumped at 660 and 600 nm, respectively, with pump fluences of 40 and 15 μJ/cm2, respectively. (a,d) TA surface plots of the transverse and adjacent dimer solutions. (b,e) Selected TA spectra. (c,f) 100 ps time delay, TA spectra along with the scaled basis spectra used to model the data and the resultant fit. Data are shown in black; transverse dimer, adjacent dimer, and monomer basis spectra are shown in purple, green, and blue, respectively; and the fit is shown in red.

