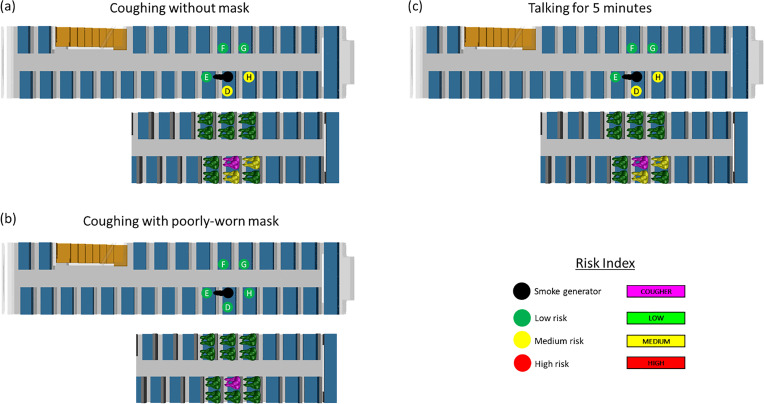
FIG. 7.
Schematics show the experimental and numerical simulation results for (a) coughing without a mask (case A1); (b) coughing with a poorly worn mask (case A2); and (c) talking for 5 min without a mask (case A3). The top schematic illustrates the results from the surrogate aerosol experiments while the bottom schematic illustrates the results from the CFD simulations. The risk levels are color coded as red, yellow, and green for high, medium, and low risk, respectively, as per the risk bands in Figs. 1 and 2.

