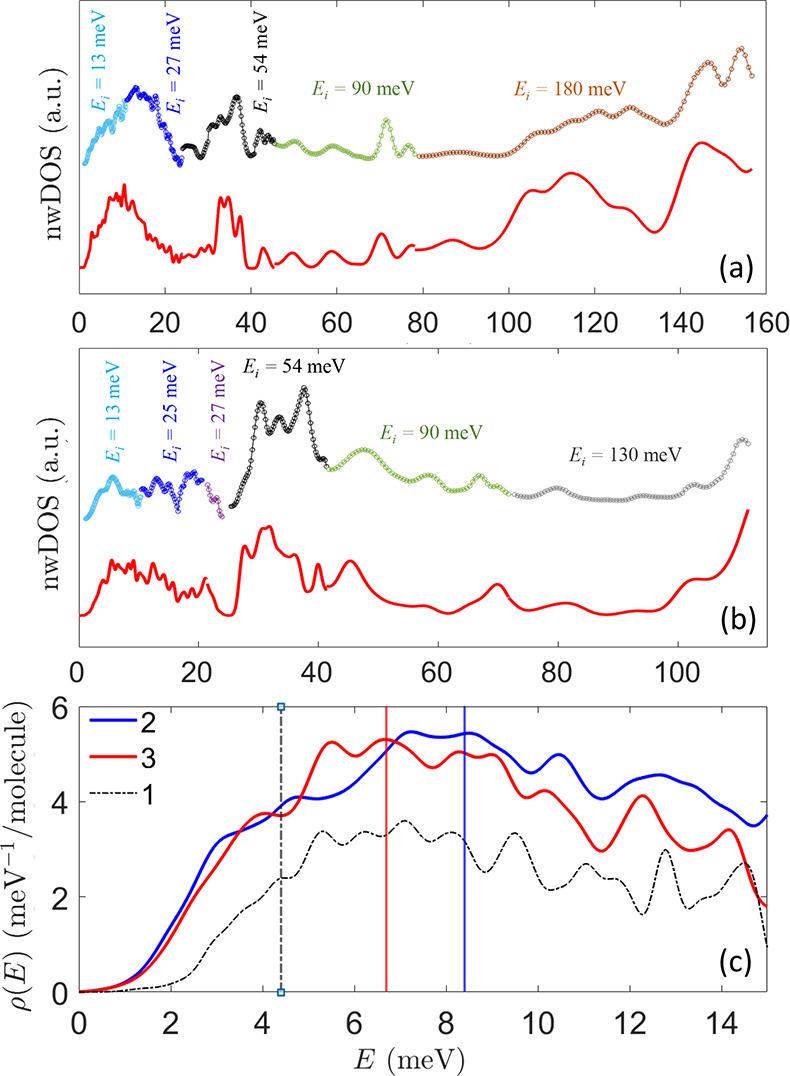
Figure 2.

Measured (symbols) and calculated (red line) nwDOS for (a) compound 2 and (b) compound 3. The neutron-weighted DOS was measured at T = 5 K with different incident neutron energies Ei and resolutions and are reported here with different colors. The fwhm of the calculated nwDOS varies accordingly to the experimental configuration. Error bars are of the order of the symbols size. (c) DFT (PBE) low-energy pDOS ρ(E) of compounds 2 and 3 (blue and red lines, respectively) compared to the ρ(E) of 1 (dashed black line) obtained with a single fwhm = 0.29 meV. For the sake of comparison, each pDOS has been normalized to the number of molecules in the unit cell. Vertical lines pinpoint the threshold energy ℏωD.
