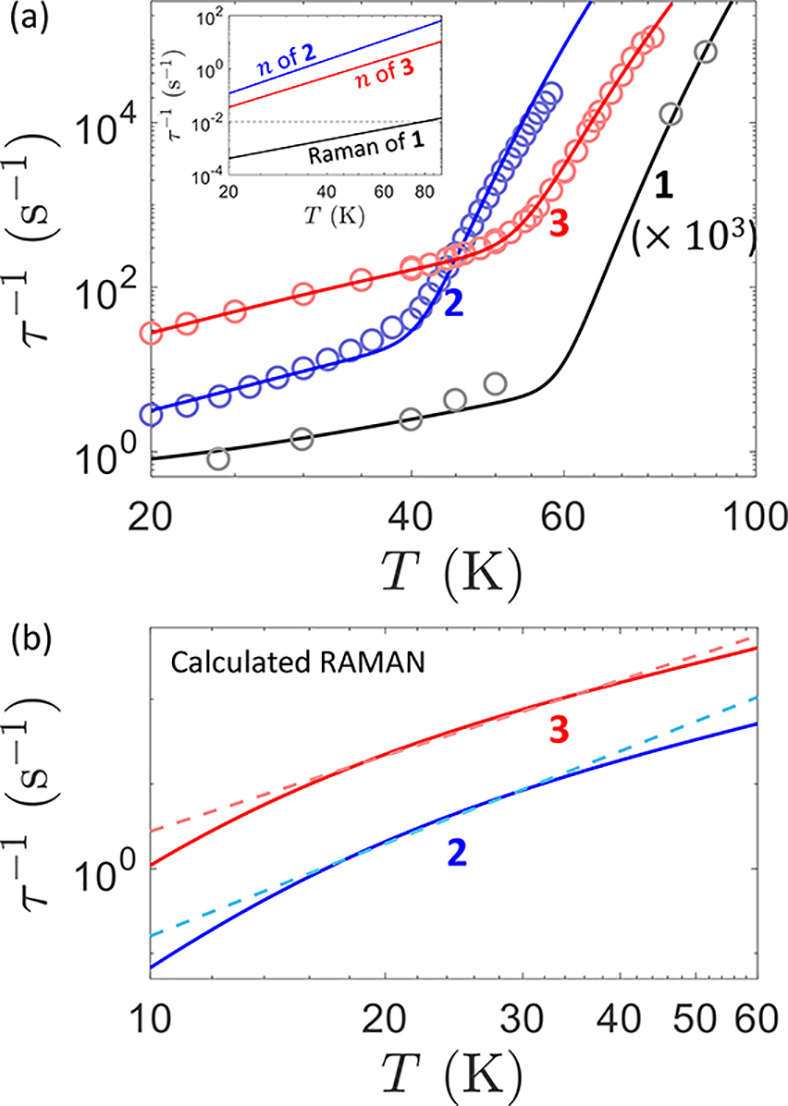
Figure 3.

Relaxation rate τ–1 for 2 (blue scatters) and 3 (red scatters) compared with relaxation rates of 1 (gray scatters). Blue, red and gray lines are the full simulation of τ–1 comprising Raman and Orbach contributions. Inset: comparison of the relaxation rate τ–1 of 1 calculated with our model and different exponent n for the Raman power-law: original values (black line), value of 2 (blue line), value of 3 (red line). The dashed line highlights the value τ–1 = 10–2 s–1, for the extrapolation of TB as the temperature at which the relaxation time is 100 s. (b) Calculated Raman relaxation rates for compound 2 and 3 (continuous lines) and corresponding fits to extract effective Raman coefficients C and n (dashed lines) using a power-law T-dependence in the 15–35 K (15–45 K) range for complex 2 (3).
