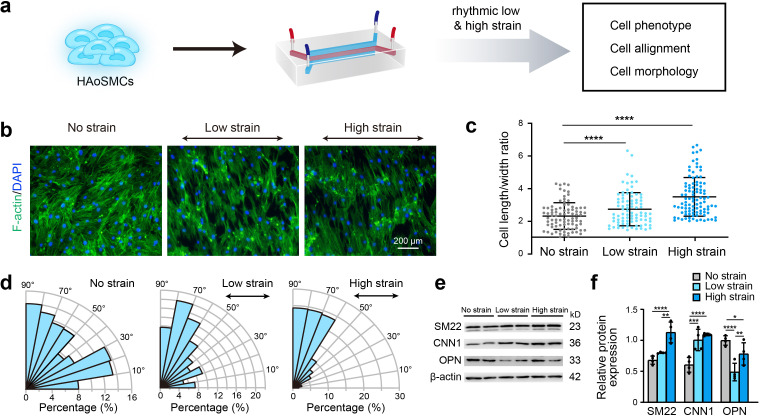
Figure 3. Effect of rhythmic strain on the cell morphology, alignment, and phenotype.
(a) Schematic workflow of cell culture on the chip model. (b) Representative images of cytoskeletal F-actin staining of HAoSMCs exposed to low or high rhythmic strain for 24 hr. The scale bar represents 200 μm. (c) Length-to-width ratio of HAoSMCs after exposure to low or high rhythmic strain for 24 hr. (n = 3, cells were measured in three fields per sample,data from every single cell were plotted. ****p < 0.0001, one-way ANOVA followed by Tukey’s post hoc test). (d) Alignments of HAoSMCs exposed to low or high rhythmic strain for 24 hr. (e) Representative images of the western blotting analyses of protein markers of the contractile phenotype (SM22 and CNN1) and synthetic phenotype (OPN) of HAoSMCs after exposure to low or high rhythmic strain for 24 hr. (f) Quantification of the total band densities for individual proteins normalized to the corresponding band of β-actin (n = 4, *p < 0.05, **p < 0.01, ***p < 0.001, ****p < 0.0001, one-way ANOVA followed by Tukey’s post hoc test). All the data are expressed as the means ± SDs.

