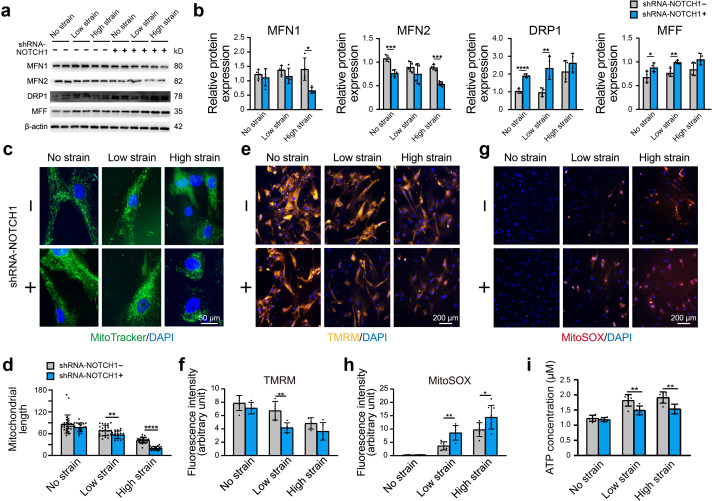
Figure 5. Effect of NOTCH1 insufficiency on mitochondrial dynamics and function in HAoSMCs.
(a) Representative images of the western blotting analyses of MFN1, MFN2, DRP1 and MFF expression in the WT and NOTCH1-KD groups under rhythmic low or high strain or static conditions. (b) Quantification of the total band densities for four individual proteins normalized to the corresponding band density of β-actin (n = 4, *p < 0.05, **p < 0.01, ***p < 0.001, ****p < 0.0001, two-way ANOVA followed by Tukey’s post hoc test). (c) MitoTracker staining images of the mitochondrial morphologies in the WT and NOTCH1-KD groups under rhythmic low or high strain or static conditions. The scale bar represents 50 μm. (d) Quantification of the mitochondria length (n = 3, **p < 0.01, ****p < 0.0001, two-way ANOVA followed by Tukey’s post hoc test). (e) TMRM staining of the mitochondrial membrane potentials in the WT and NOTCH1-KD groups under rhythmic low or high strain or static conditions. The scale bar represents 100 μm. (f) Quantification of the relative TMRM fluorescence intensity (**p < 0.01, two-way ANOVA followed by Tukey’s post hoc test). (g) MitoSOX staining of mitochondrial superoxide generation in the WT and NOTCH1-KD groups. The scale bar represents 100 μm. (h) Quantification of the relative MitoSOX fluorescence intensity (n=3, data from three independent biological replicates each with two to three technical replicates were plotted. *p < 0.05, **p < 0.01, two-way ANOVA followed by Tukey’s post hoc test). (i) The ATP concentrations were measured using an ATP Determination Kit (n=3, data from three independent biological replicates each with two technical replicates were plotted. **p < 0.01, two-way ANOVA followed by Tukey’s post hoc test). Quantitative measurements were calculated using ImageJ software. All the data are expressed as the means ± SDs.

