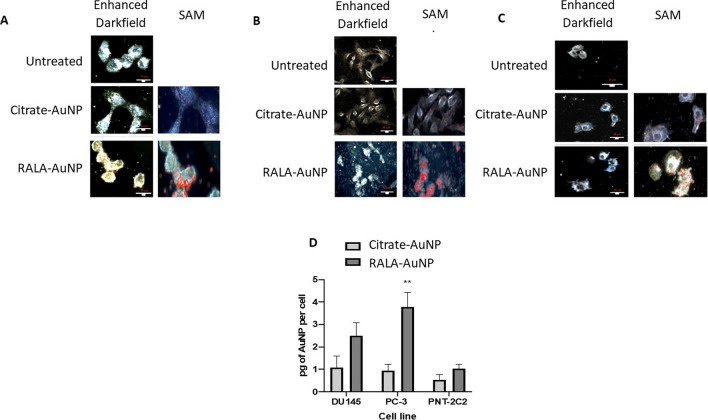
Fig. 2.
Internalisation of citrate-AuNP and RALA-AuNP complexes in PCa and prostate epithelial cell lines as measured by ICP-MS and Cytoviva. For Cytoviva imaging cells were treated for 6 h with citrate-AuNP and RALA-AuNP at a 25 µg RALA:1 µg AuNP ratio. Representative images include enhanced darkfield and the corresponding hyperspectral images overlaid with the spectral angle map depicting the presence of AuNPs in red. Scale bars are equal to 40 µm. A DU145 B PC-3 C PNT2-C2. D For ICP-MS quantification of intracellular Au, cells were treated for 6 h with citrate-AuNP and a w:w ratio of 25 µg RALA:1 µg AuNP. Post treatment cells were trypsinised, dissolved in aqua regia and diluted in molecular grade water. Samples were analysed alongside a series of standards of known concentrations. One-way ANOVA statistical analysis was performed

