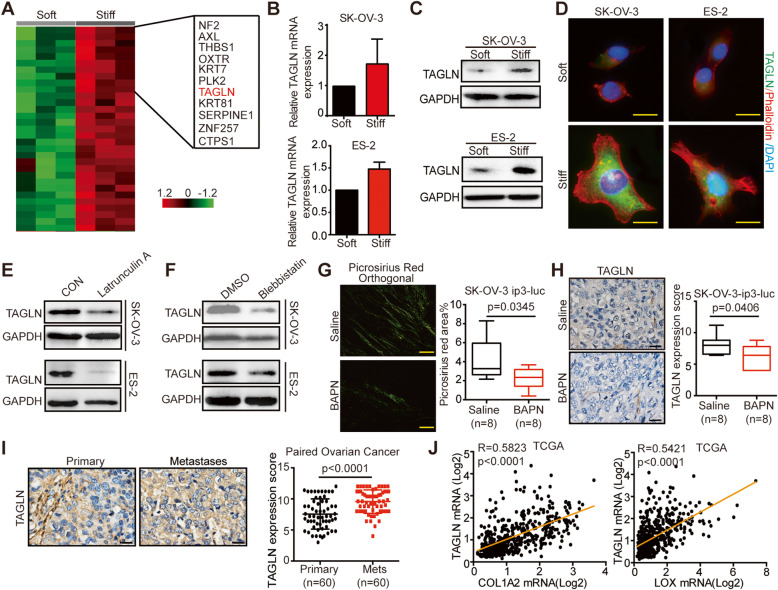
Fig. 3.
TAGLN is identified as a stiffness-regulated gene in ovarian cancer. A Transcriptomic profiling of SK-OV-3 cells cultured on soft (0.25 kPa) or stiff (10.5 kPa) PA gels. The heat map shows genes upregulated in SK-OV-3 cells cultured on stiff PA gels compared to soft PA gels. Green or red in the heat map indicate genes expression that was relatively low or high, respectively. B Relative TAGLN mRNA expression levels of SK-OV-3 and ES-2 cells cultured on soft versus stiff substrates determined by quantitative PCR. C Western blot determined the expression of TAGLN in SK-OV-3 and ES-2 cells cultured on soft or stiff substrates. D Immunofluorescence of SK-OV-3 and ES-2 cells cultured on soft or stiff substrates: TAGLN (green), phalloidin (red), and DAPI (blue). Scale bar: 20 μm. E Western blot showing TAGLN expression in SK-OV-3 and ES-2 cells treated with Latrunculin A (0.1 µM, 24 h). GAPDH was used as a loading control. F Western blot showing TAGLN expression in SK-OV-3 and ES-2 cells treated with blebbistatin (10 µM, 24 h). GAPDH was used as a loading control. G Photomicrographs of paired tumors of HGSOC in stained with picrosirius red, viewed under orthogonal polarizing filters (left) and quantification (right) (n = 8). Scale bar: 50 μm. H Representative images (left) and scores (right) of IHC staining for TAGLN from mice treated with saline or BAPN (n = 8). Scale bar: 20 μm. I IHC staining for TAGLN expression of tissues from paired tumors of HGSOC. Representative images were shown left (Scale bar: 20 μm) and scores right (n = 60). J Pearson correlation analysis of TAGLN with COL1A2 and LOX in TCGA datasets

