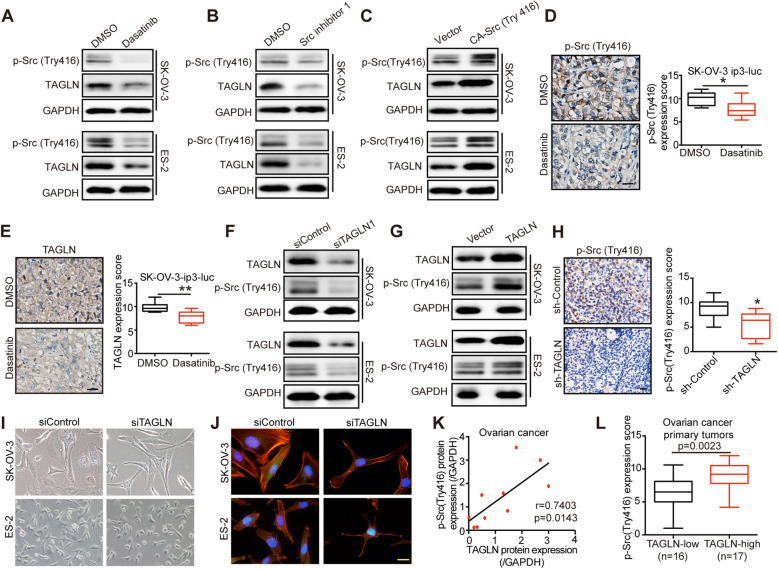
Fig. 5.
TAGLN and Src activation form a regulation loop. A Western blot analyzed TAGLN and p-Src (Try416) expression of cells treated with dasatinib (20 nM, 24 h). GAPDH was used as a loading control. B Western blot analyzed TAGLN and p-Src (Try416) expression of cells treated with Src inhibitor 1 (50 nM, 24 h). GAPDH was used as a loading control. C Lysates from cells transfected with vector or active Src Y416F plasmid (CA-Src416) were analyzed by SDS–PAGE and probed for TAGLN, p-Src (Try416) and GAPDH. D-E Representative images of IHC staining and scores of p-Src (Try416) (D)and TAGLN (E) from mice treated with DMSO or dasatinib (n = 8, *P < 0.05, **P < 0.01). Scale bar: 20 μm. F Western blot analyzed TAGLN and p-Src (Try416) expression of cells transfected with siControl or siTAGLN. GAPDH was used as a loading control. GWestern blot analyzed TAGLN and p-Src (Try416) expression of cells transfected with vector or TAGLN plasmid. GAPDH was used as a loading control. H Representative images (left) and scores (right) of p-Src (Try416) IHC staining of tumor tissues from mice bearing SK-OV-3 cells transfected with sh-control or sh-TAGLN (*P < 0.05). Scale bar: 20 μm. I Phase images showing typical morphology of SK-OV-3 and ES-2 cells transfected with siControl or siTAGLN. J Representative immunofluorescence images of SK-OV-3 and ES-2 cells transfected with siControl or siTAGLN for phalloidin (red) and with DAPI (blue). Scale bar: 20 μm. K Correlation between TAGLN and p-Src (Try416) protein expression in primary tumors of ovarian cancer tissues (n = 10 biological replicate samples). L Immunohistochemical analysis of TAGLN and p-Src (Try416) expression from primary tumors of EOC. The scores of p-Src (Try416) in the TAGLN-low group (n=16) and TAGLN-high group (n=17) was calculated

