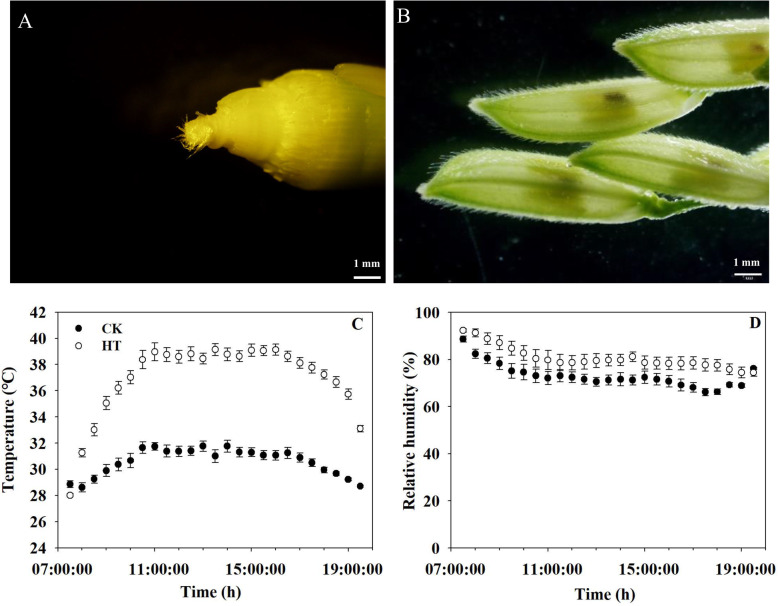
Fig. 7.
Panicle phenotypes at the beginning and end of temperature treatment and average daytime (7:30–19:30 h) temperature and relative humidity during the entire high temperature treatment period. A indicates the young panicle during the 2nd stage of panicle development at the beginning of temperature treatment, B indicates the spikelets during pollen maturity at the end of temperature treatment. C, D are temperature and relative humidity, respectively, data are the average over four sensors ± standard error of the mean (n = 4) every half hour (the average over 28 days) during the temperature treatments. CK, control temperature treatment; HT, high temperature treatment

