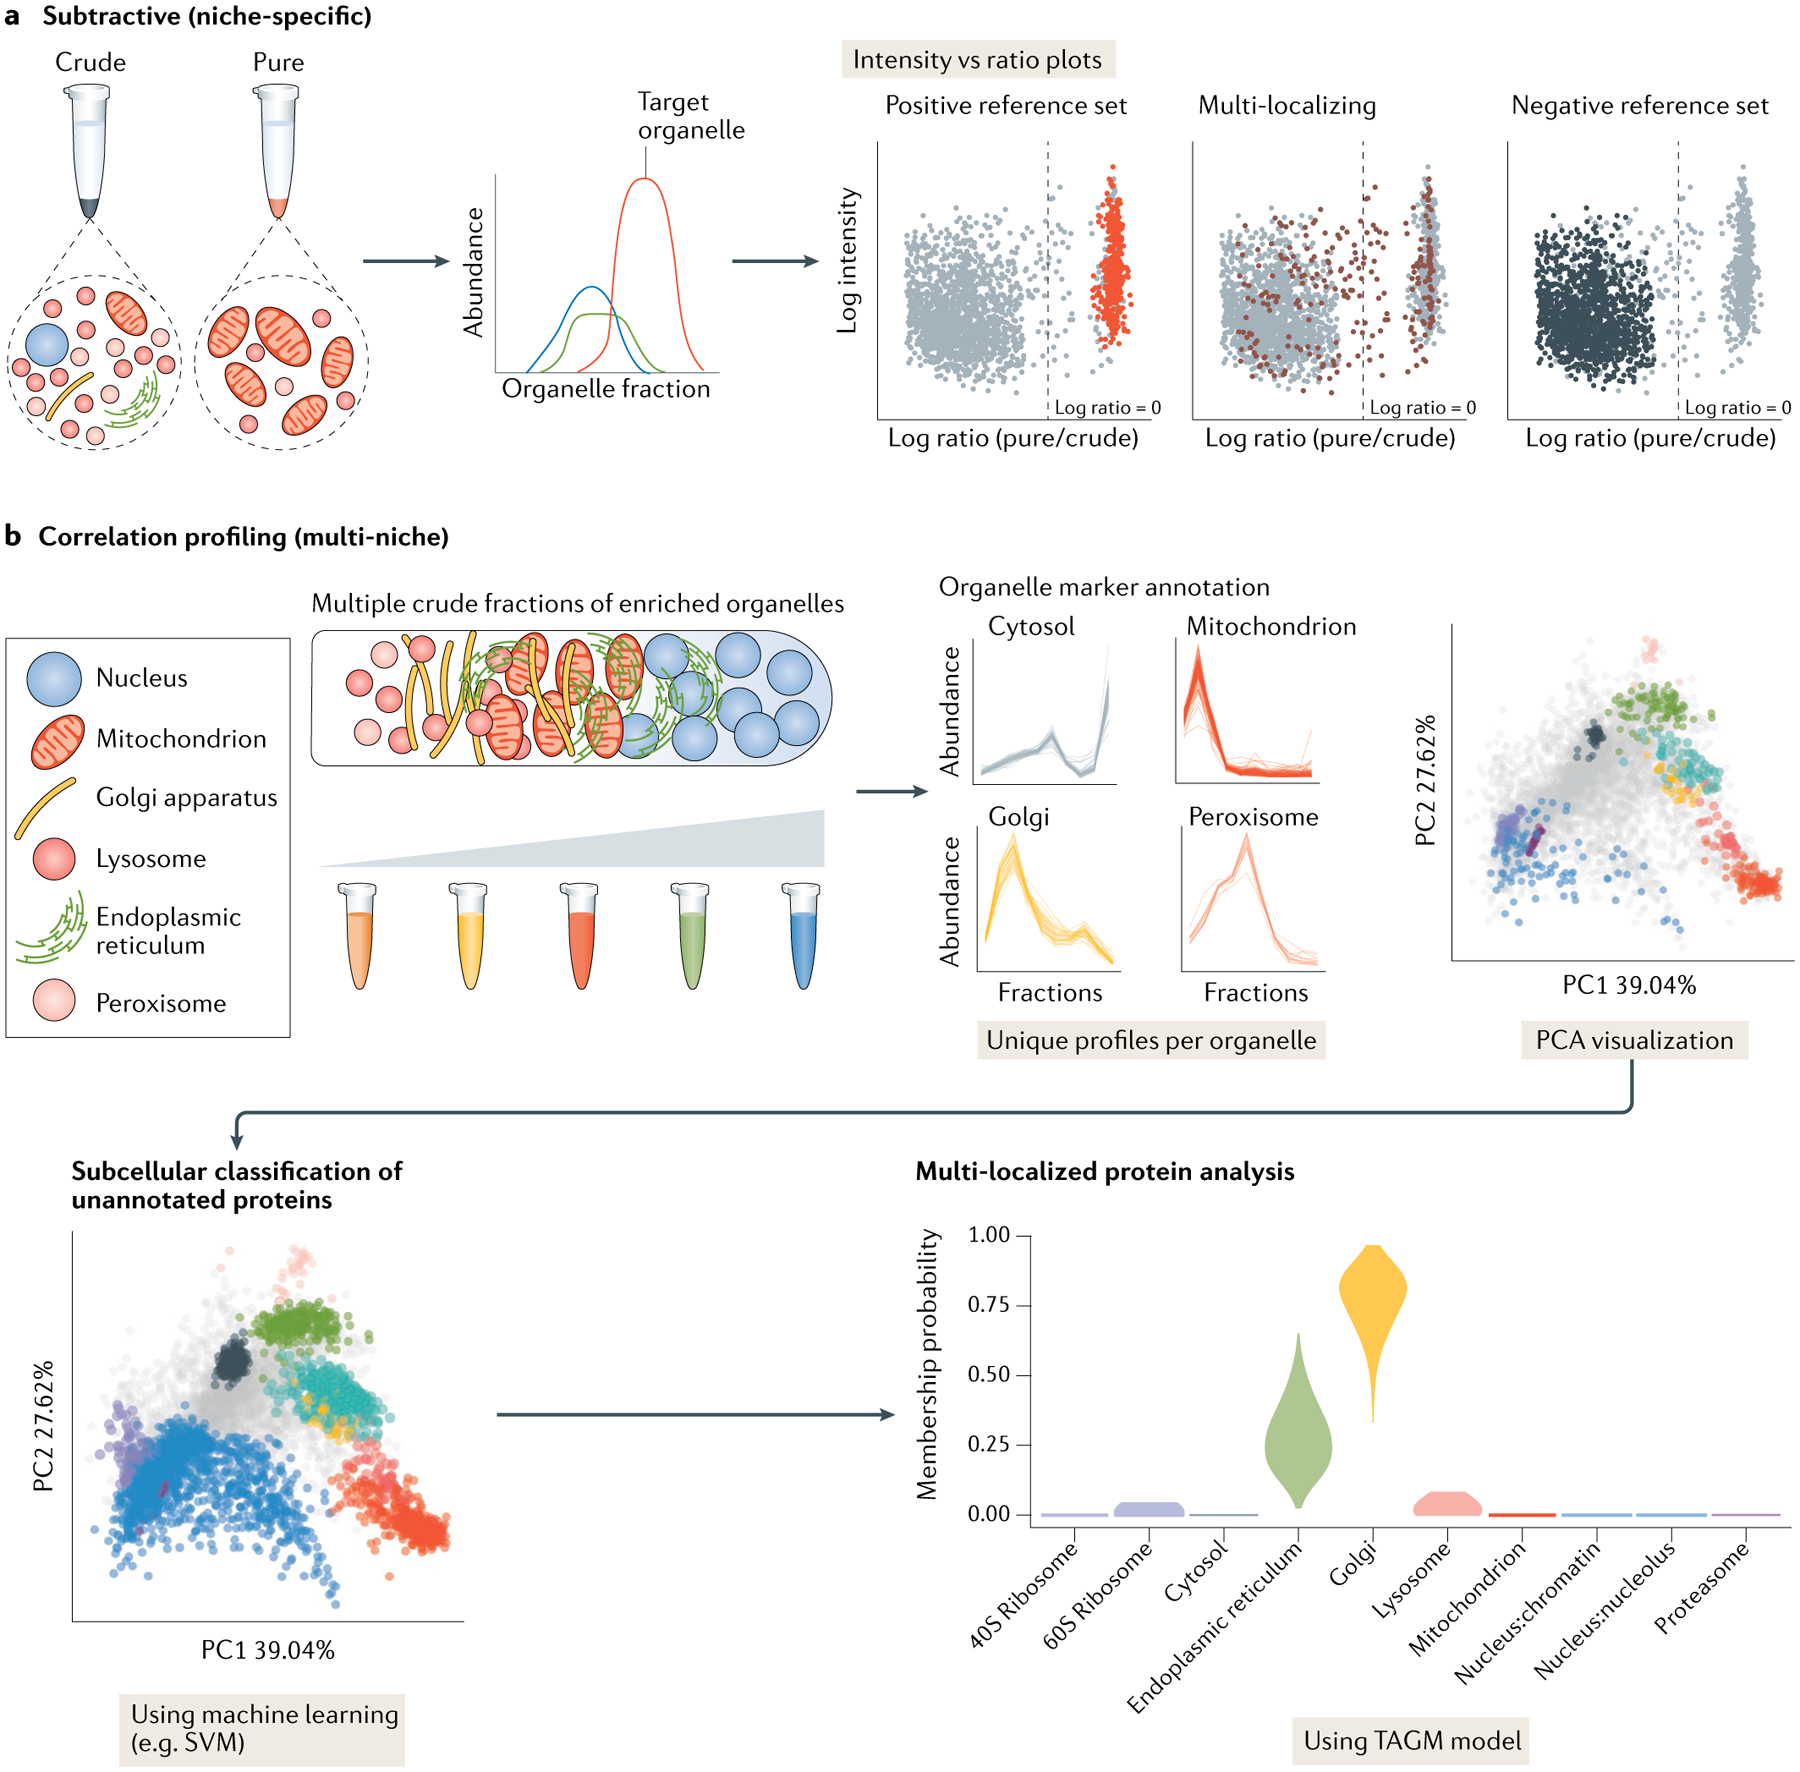
Fig. 5 |. Subtractive versus correlation profiling analysis.

a | Subtractive proteomics techniques involve purifying an organelle of interest — usually using a combination of sedimentation and density centrifugation — alongside one or more crude fractions containing ‘contaminant’ components. By quantifying protein markers for the organelle of interest and proteins from the crude fractions using quantitative liquid chromatography with tandem mass spectrometry (LC-MS/MS), intensity versus ratio plots can be produced and used to distinguish true residents of the organelle of interest versus contaminants. b | In cell-wide correlation profiling experiments, multiple organelle-enriched fractions are collected across a sedimentation or density gradient. This allows for the unique profiles of multiple subcellular niches to be generated by annotation with organellar marker proteins. The variance of each organellar niche can be represented using dimension reduction methods such as principle component analysis (PCA). Markers can be used to train machine learning algorithms such as support vector machines (SVMs) or T-augmented Gaussian mixture models (TAGMs)52 to assign unannotated proteins, and find posterior probabilities of proteins belonging to multiple organelles in order to elucidate the locations of MLPs. Intensity versus ratio plots in part a adapted with permission from REF.29. Elements of part b adapted from REF.43, Springer Nature Limited, apart from TAGM plot adapted from REF.156, CC BY 4.0 (https://creativecommons.org/licenses/by/4.0/).
