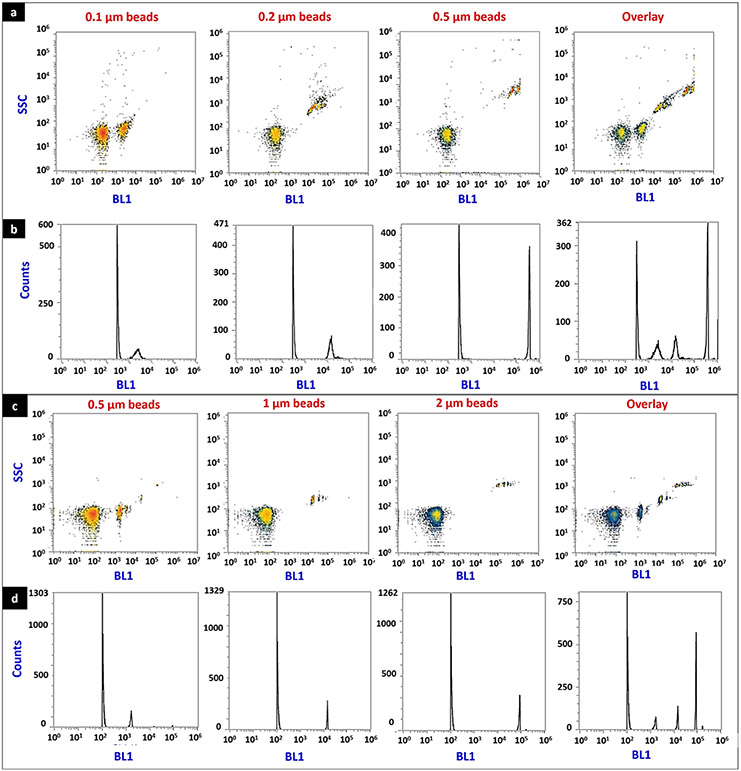
Fig. 3.
Flow cytometry analysis of calibration beads. Calibration beads with particle diameters ranging from 0.1 to 2 μm were diluted in PBS, and events were acquired in the side scatter (SSC), forward scatter (FSC), and a small particle side scatters 488/10-nm filter (BL1) channels in an Attune flow cytometer. Representative density plots of beads ranging from 0.1 to 0.5 μm (a), and 0.5–2 μm (c), histograms of beads ranging from 0.1 to 0.5 μm (b), and 0.5–2 μm (d). In density plots, X-axis represents the number of events captured in the side scatter 488/10-nm filter (BL1), whereas the Y-axis represents the number of events acquired in SSC. In histograms, X-axis represents the events captured by BL1, whereas the Y-axis represents the total count of the events. The axes scale in these plots were automatically adjusted by the Attune NxT software

