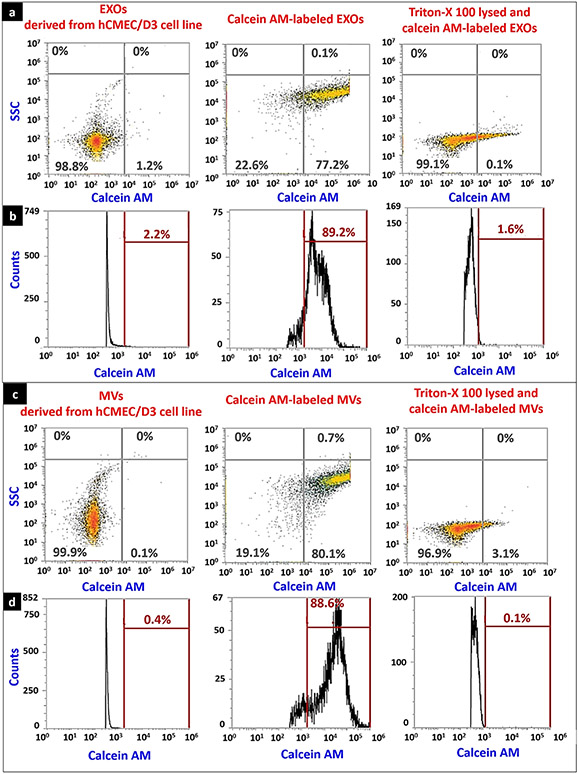
Fig. 4.
Integrity of hCMEC/D3 cell line–derived EVs after ultracentrifugation and resuspension determined using flow cytometry. EVs were isolated from hCMEC/D3 cell line using sequential ultracentrifugation and the pellets were resuspended in PBS. EXOs and MVs at 20 μg/mL were labeled with 10 μM calcein AM. In a separate experiment, EVs were lysed with Triton-X 100 (2%) solution and were labeled with calcein AM. An aliquot of each sample was analyzed for calcein-positive EVs using an Attune NxT flow cytometer. The representative density plots (a), and histograms (b) of EXOs, calcein AM–labeled EXOs, and Triton-X 100-lysed calcein-labeled EXOs. The representative density plots (c), and histograms (d) of MVs, calcein AM–labeled MVs, and Triton-X 100-lysed calcein-labeled MVs. In density plots, X-axis represents the number of calcein-positive events captured in the side scatter 488/10-nm filter (BL1), whereas the Y-axis represents the number of events acquired in the side scatter (SSC). In histograms, X-axis represents the number of calcein-positive events captured in the side scatter 488/10-nm filter (BL1), whereas the Y-axis represents the total count of the events. The axes scale in these plots were automatically adjusted by the Attune NxT software. The data shown are representative plots of n = 3 samples

